Tumor Microenvironment Diagram Generator
Use the tumor microenvironment diagram generator to organize tumor cells, immune cells, stromal cells, blood vessels and extracellular matrix. Show the interactions relevant to your model without implying a patient-specific result.
SEE ACADRAW IN ACTION
Science drawing, from idea to editable figure
Create a science illustration with AI. Refine drawings, build editable diagrams, and convert images to SVG.
Demos play as you scroll into view. Choose a feature to explore.
Trusted by students & researchers from 480+ universities
A global community spanning 60+ countries and regions, from QS top-ranked universities to leading research institutes
























University logos belong to their respective institutions and are shown solely to illustrate our user community. They do not imply any partnership or endorsement.
Tool overview
Explore the use cases, workflow, and key things to know.
Define the model
Specify tumor type, tissue setting, cell populations and the interaction of interest.
Arrange the neighborhood
Use the tumor microenvironment diagram generator with labeled cells, matrix and interaction types.
Review the biological claims
Check cell identity, compartment boundaries and evidence for each arrow.
Concept reference
Tumor microenvironment: a cellular neighborhood
A central tumor-cell region is surrounded by immune cells, fibroblasts, extracellular matrix and a blood vessel. A legend separates cell identity from interaction labels.
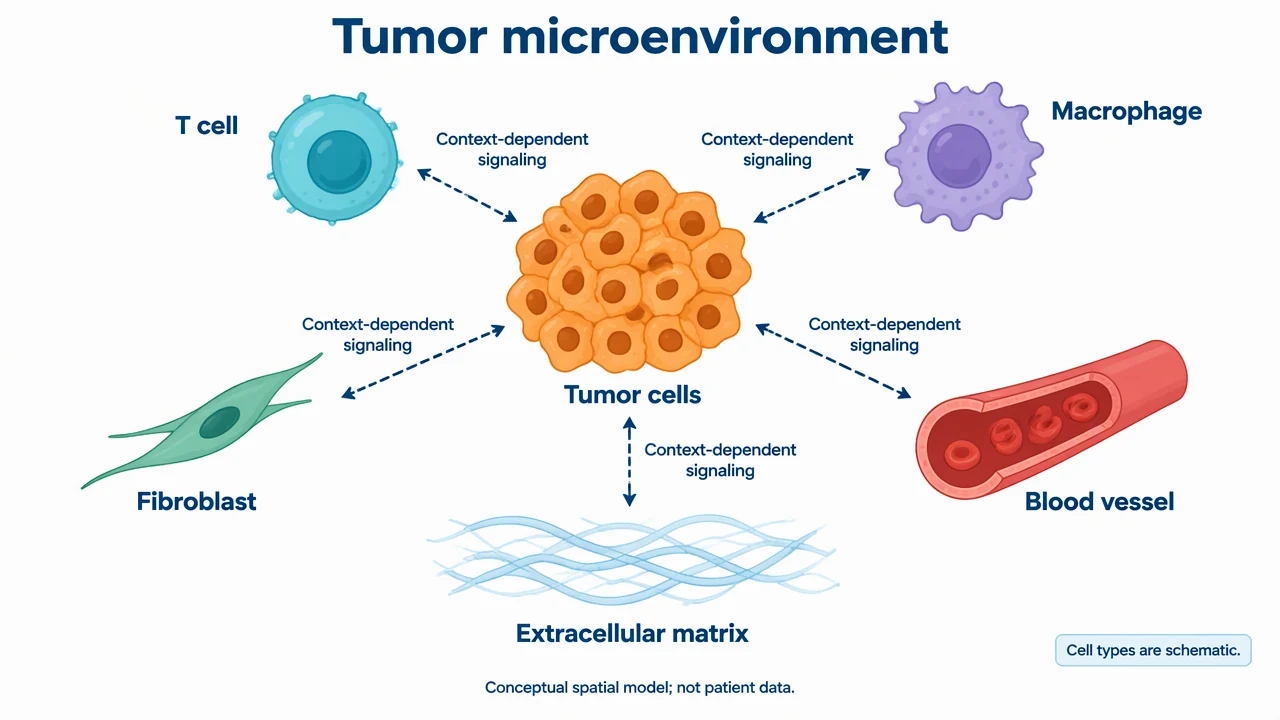
Tumor Microenvironment Diagram Generator: reference key
Use the reference and definitions together. On a small screen, scroll the table horizontally.
| Element | Meaning | Review check |
|---|---|---|
| Tumor cell | A malignant-cell population in the model | State cancer type or model in the caption. |
| Immune cell | A defined immune population | Name the cell type rather than assuming a single immune effect. |
| Fibroblast | A stromal cell with context-dependent functions | Avoid treating all fibroblasts as identical. |
| Blood vessel | Vascular supply and endothelial context | A drawn vessel does not establish perfusion. |
| Extracellular matrix | Structural and biochemical surroundings | Separate matrix fibers from migration paths. |
| Interaction | A selected signaling or physical relationship | Label the mechanism and evidence; avoid unlabeled causal arrows. |
Tumor Microenvironment Diagram Generator: plan the visual
Use the tumor microenvironment diagram generator to organize tumor cells, immune cells, stromal cells, blood vessels and extracellular matrix. Show the interactions relevant to your model without implying a patient-specific result.
Choose one biological question
A treatment-delivery figure needs different details from an immune-exclusion figure. Use the tumor microenvironment diagram generator to focus on the selected interaction, then retain only the cell populations and compartments needed to explain it.
Separate cell identity and cell state
A T cell label names a population; activation or exhaustion describes a state that needs context and evidence. Likewise macrophage behavior cannot be captured by color alone. Use explicit labels and define the study system rather than assigning universal roles.
Keep spatial and causal claims distinct
A vessel near tumor cells is a spatial arrangement. A signaling arrow is a proposed or supported relationship. Draw boundaries and an arrow key so proximity is not mistaken for causation, and identify which connections come from the study.
Common mistakes to avoid
Using one cell as the entire immune system
Different immune populations have different roles. Include the relevant cell types and avoid a single generic immune icon with a universal effect.
Presenting a schematic as histology
A generated tissue-like layout is an illustration. Do not imply that it shows a patient section or measured spatial distribution.
Predicting response from an arrow
A pathway relationship alone does not establish a treatment outcome. Qualify study-specific hypotheses in the caption.
Tumor Microenvironment Diagram Generator: from brief to draft
Reading the reference is free. Generating a new draft requires an account and available credits. See current pricing.
Choose Science Drawing for an illustrated draft, or Editable Diagram for separate shapes and labels. Review all definitions, labels and connections before sharing.
- 1
Define the model
Specify tumor type, tissue setting, cell populations and the interaction of interest.
- 2
Arrange the neighborhood
Use the tumor microenvironment diagram generator with labeled cells, matrix and interaction types.
- 3
Review the biological claims
Check cell identity, compartment boundaries and evidence for each arrow.
Example brief for the tumor microenvironment diagram generator
Original educational scientific illustration on white, 1280x720 landscape. Crisp vector-like editorial artwork, navy text, teal and amber accents, generous whitespace, large legible English labels. All structures, labels and connecting arrows rendered by the image model. No third-party artwork, logo, photograph, experimental measurement or numerical performance claim. Title 'Tumor microenvironment'. Central irregular cluster labeled 'Tumor cells'; around it separate clearly labeled 'T cell', 'Macrophage', 'Fibroblast', 'Blood vessel', and pale fibers labeled 'Extracellular matrix'. Dashed arrows labeled 'Context-dependent signaling' between tumor and surrounding cells. Small key 'Cell types are schematic'. Do not show immune cells turning into tumor cells, patient tissue, treatment outcome, percentages or microscopy. Footer 'Conceptual spatial model; not patient data'.
Use this prompt in the generatorTumor Microenvironment Diagram Generator: common questions
What can the tumor microenvironment diagram generator illustrate?
It can draft a conceptual neighborhood of tumor cells, immune and stromal cells, vessels, matrix and selected interactions.
Can it interpret a tumor biopsy?
No. It does not diagnose tissue or infer patient-specific cellular composition.
Can I show a therapy hypothesis?
Yes, as a clearly labeled hypothesis based on the study context; the drawing does not establish efficacy.
Should every interaction be shown?
No. Select the relationships needed for the figure question and provide a legend for each line type.
Sources and editorial notes
Prepared by the AcaDraw product team. Source and diagram check: . This is a simplified educational model; independent expert review has not been completed. AI-generated drafts need checking against reliable references.
Explore the tumor microenvironment diagram guide
A central tumor-cell region is surrounded by immune cells, fibroblasts, extracellular matrix and a blood vessel. A legend separates cell identity from interaction labels.
Tumor Microenvironment: Cells, Matrix, and Signaling