Medical Infographic Maker
A medical infographic needs a clear reading path, careful terms and visible sources. Use this maker to draft an educational layout, then have qualified reviewers check accuracy, audience and safety before publishing.
SEE ACADRAW IN ACTION
Science drawing, from idea to editable figure
Create a science illustration with AI. Refine drawings, build editable diagrams, and convert images to SVG.
Demos play as you scroll into view. Choose a feature to explore.
Trusted by students & researchers from 480+ universities
A global community spanning 60+ countries and regions, from QS top-ranked universities to leading research institutes
























University logos belong to their respective institutions and are shown solely to illustrate our user community. They do not imply any partnership or endorsement.
Tool overview
Explore the use cases, workflow, and key things to know.
Define the audience
Write the question, setting and safety boundary for the intended reader.
Build the sections
Draft a short explanation with source notes, icons and a logical reading order.
Review before use
Ask a qualified reviewer to check claims, accessibility and the risk of misinterpretation.
Concept reference
Medical infographic: a worked reference
The example organizes preparation for a medical appointment into Before the visit, During the visit and Before you leave. It demonstrates a plain-language layout with practical prompts, not diagnosis, treatment or patient data.
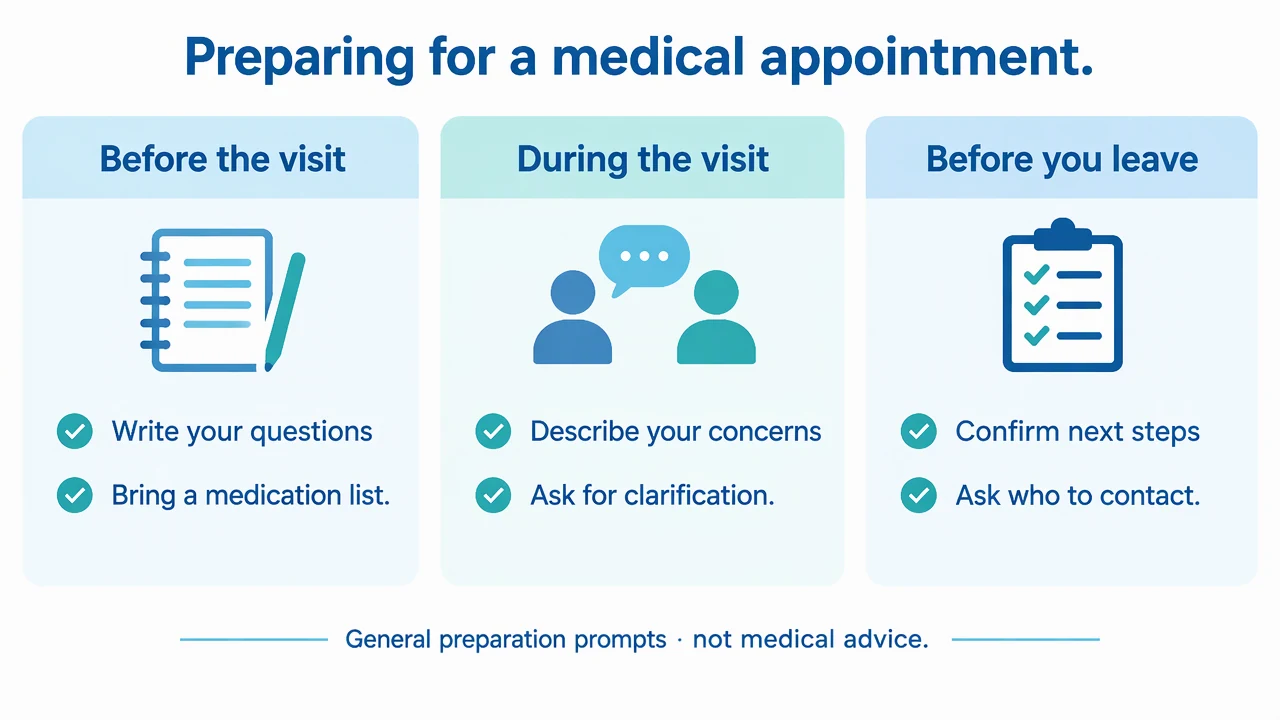
Medical infographic element key
Use the reference and definitions together. On a small screen, scroll the table horizontally.
| Element | Meaning | Review check |
|---|---|---|
| Audience | People who need the explanation | State reading level, language and prior knowledge. |
| Claim | A plain-language statement | Check it against an authoritative medical source. |
| Visual cue | Icon, sequence or comparison | Avoid implying diagnosis, certainty or scale without evidence. |
| Safety boundary | What the graphic cannot answer | Add a clear route to qualified professional advice. |
| Source note | References and review date | Make the source visible and keep it current. |
Plan your medical infographic
Use medical infographics to explain established concepts and processes. A generated layout is not a diagnosis, treatment recommendation or patient-specific result.
Lead with the question
A reader should know what the graphic explains and who it is for before meeting technical terms.
Pair words with visuals
Icons and short labels can support comprehension, but they must not add a clinical claim the text does not support.
Review for harm
Check wording, translations, accessibility and the risk that a reader may treat general education as personal advice.
Common mistakes to avoid
Overpromising certainty
Avoid “always,” “safe for everyone” or outcome guarantees unless an authoritative source supports that exact scope.
Hiding the source
A tiny reference at the bottom can be unreadable. Use a short source label and a linked or printable reference list.
Implying a diagnosis
Generic anatomy or symptoms should not look like an assessment result for the viewer.
Medical Infographic Maker: from brief to checked draft
Reading the reference is free. Generating a new draft requires an account and available credits. See current pricing.
Choose Science Drawing for an illustrated draft, or Editable Diagram for separate shapes and labels. Review all definitions, labels and connections before sharing.
- 1
Define the audience
Write the question, setting and safety boundary for the intended reader.
- 2
Build the sections
Draft a short explanation with source notes, icons and a logical reading order.
- 3
Review before use
Ask a qualified reviewer to check claims, accessibility and the risk of misinterpretation.
A prompt you can adapt
Create a plain-language medical appointment preparation infographic with Before the visit, During the visit and Before you leave sections. Include writing questions, bringing a medication list, asking for clarification and confirming next steps. Use generic icons and a general preparation note; do not give diagnosis or treatment instructions.
Use this prompt in the generatorMedical Infographic FAQ
Can a medical infographic diagnose a condition?
No. It can explain general information, but diagnosis and treatment decisions require qualified clinical assessment.
How many sources should it show?
Show the key authoritative sources for the claims and provide a way to inspect the full references.
Can I use patient data?
Only through an approved privacy and review process. This page does not analyze patient data or generate outcome charts.
What makes a medical infographic accessible?
Plain language, readable type, strong contrast, text alternatives and a non-color cue for important distinctions.
Sources and editorial notes
Prepared by the AcaDraw product team. Source and diagram check: . This is a simplified educational model; independent expert review has not been completed. AI-generated drafts need checking against reliable references.
Explore the medical infographic guide
Use medical infographics to explain established concepts and processes. A generated layout is not a diagnosis, treatment recommendation or patient-specific result.
Medical Infographic: Clear Explanations, Sources, and Safety Boundaries