TOC Graphics Generator
Use a TOC graphics generator to summarize one reaction or finding in a single visual story. Keep structures, labels and scope clear without inventing yields or data.
SEE ACADRAW IN ACTION
Science drawing, from idea to editable figure
Create a science illustration with AI. Refine drawings, build editable diagrams, and convert images to SVG.
Demos play as you scroll into view. Choose a feature to explore.
Trusted by students & researchers from 480+ universities
A global community spanning 60+ countries and regions, from QS top-ranked universities to leading research institutes
























University logos belong to their respective institutions and are shown solely to illustrate our user community. They do not imply any partnership or endorsement.
Tool overview
Explore the use cases, workflow, and key things to know.
Define the purpose
State whether the figure explains a setup, process, interpretation or reporting boundary.
Label the convention
Explain what each arrow, line, color or control means.
Review the limits
Keep generated visuals separate from real measurements and source files.
Concept reference
TOC graphic: one reaction story
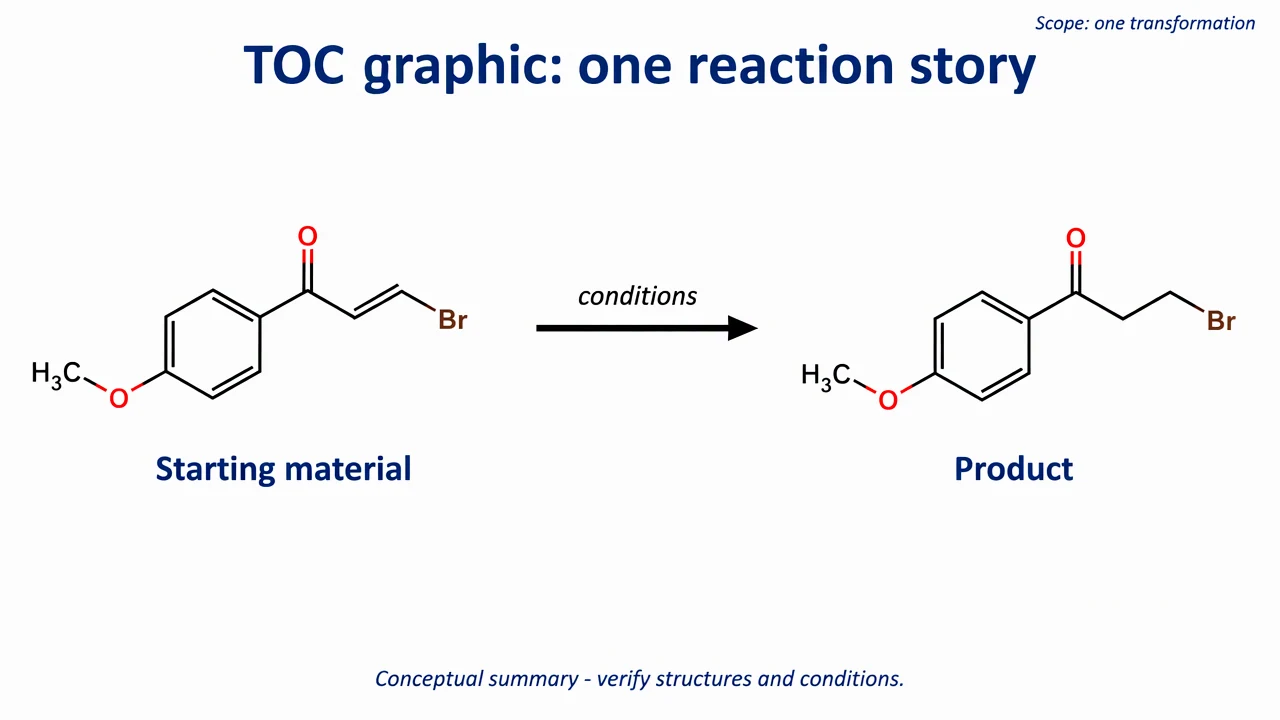
A single-panel reaction summary with a starting material, one arrow and a product. The structures and conditions require author review; no yield or analytical result is implied.
TOC Graphics Generator: reference key
Use the reference and definitions together. On a small screen, scroll the table horizontally.
| Element | Meaning | Review check |
|---|---|---|
| Starting material | The input structure or state | Check formula, stereochemistry and naming. |
| Reaction arrow | The summarized transformation | Use verified conditions and direction. |
| Product | The stated outcome | Do not imply yield or purity without data. |
| Scope | The single story chosen for the panel | Move supporting detail to the article. |
| Caption | A short explanatory note | State what is conceptual or simplified. |
| Review | The author’s chemistry check | Verify every structure before submission. |
TOC Graphics Generator: plan the content
A table-of-contents graphic is a compact entry point, not a miniature paper. One transformation and one takeaway are usually clearer than a crowded collage of mechanisms, spectra and claims.
Start with the purpose of the toc graphics
A useful toc graphics begins with one question. Decide whether the visual should explain setup, process order, interpretation or a reporting boundary. A crowded diagram can contain accurate icons and still fail if the reader cannot tell what to notice first. The reference image is deliberately bounded. It uses labels and arrows to organize a teaching explanation, not to substitute for a protocol, a result file or a validated device. Write the scope in the caption before adding detail.
Separate the visual convention from the claim
Colors, line weights and arrows help a reader follow a toc graphics, but they do not automatically represent measured magnitude or certainty. Define what an arrow means and state when a panel is illustrative. If the figure includes a control, label what decision that control supports. This distinction matters when a familiar visual resembles a result. A band, test line, gate, signal or property label can look authoritative even when it is only a teaching placeholder. Preserve that boundary in the legend and surrounding text.
Keep provenance and review visible
Before sharing a toc graphics, compare every label with a reliable source and the actual question. Record the source image, method context, assumptions and edits. If the topic involves an assay or material, keep experimental observations in their own record rather than filling gaps with a plausible generated visual. A concise reference key makes review easier. It tells collaborators which terms are structural, which are process events and which are interpretations. That key is often more valuable than adding another decorative arrow.
Common mistakes in a toc graphics
Separate the visual convention from the claim
Colors, line weights and arrows help a reader follow a toc graphics, but they do not automatically represent measured magnitude or certainty. Define what an arrow means and state when a panel is illustrative. If the figure includes a control, label what decision that control supports. This distinction matters when a familiar visual resembles a result. A band, test line, gate, signal or property label can look authoritative even when it is only a teaching placeholder. Preserve that boundary in the legend and surrounding text.
Keep provenance and review visible
Before sharing a toc graphics, compare every label with a reliable source and the actual question. Record the source image, method context, assumptions and edits. If the topic involves an assay or material, keep experimental observations in their own record rather than filling gaps with a plausible generated visual. A concise reference key makes review easier. It tells collaborators which terms are structural, which are process events and which are interpretations. That key is often more valuable than adding another decorative arrow.
Use the draft as a reviewable starting point
The toc graphics tool helps turn a brief into a visual draft. It cannot decide whether a sample is valid, whether a mechanism is complete or whether a conclusion follows from a measurement. Ask a domain reviewer to check the final figure when the visual will guide an experiment, publication or health decision. Export the figure with a caption that names the scope and limits. Keep real data, source files and calculation records linked to the final version. A transparent workflow lets readers understand what the image explains and what it leaves unanswered.
TOC Graphics Generator: from brief to reviewed draft
Reading the reference is free. Generating a new draft requires an account and available credits. See current pricing.
Choose Science Drawing for an illustrated draft, or Editable Diagram for separate shapes and labels. Review all definitions, labels and connections before sharing.
- 1
Write a bounded brief
Describe the scope, participants and visual conventions needed for this figure.
- 2
Generate a structured draft
Choose an illustrated or editable layout, then keep labels and arrows explicit.
- 3
Review before sharing
Compare the result with the source, method or design record and revise unsupported claims.
Example brief for a toc graphics
Original table-of-contents graphic for a chemistry research article, white 1280x720 landscape, professional clean vector-like composition, readable English labels. Title 'TOC graphic: one reaction story'. Show one central substrate structure labeled 'Starting material' on the left, a single bold reaction arrow with small condition label 'conditions', and one product structure labeled 'Product' on the right. Add a small top-right caption 'Scope: one transformation' and footer 'Conceptual summary - verify structures and conditions'. Keep a single visual story, no reaction yield, no spectra, no data chart, no fabricated molecules with unreadable formulas, no logos or copied published artwork. Render all labels, structures and arrows in the image.
Use this prompt in the generatorTOC Graphics Generator: common questions
What does the toc graphics tool create?
It creates an educational draft from your description. It does not infer real measurements or validate an experiment.
Can it generate a complete publication figure?
It can start a compact visual draft. Authors must verify structures, conditions and the intended journal requirements.
What should I review before sharing?
Check labels, directions, scope and the source-specific details in the toc graphics figure.
Does it support real data analysis?
No. This page is for qualitative visual explanation and editable drafting, not computation from a data table.
Sources and editorial notes
Prepared by the AcaDraw product team. Source and diagram check: . This is a simplified educational model; independent expert review has not been completed. AI-generated drafts need checking against reliable references.
Read the toc graphics guide
A table-of-contents graphic is a compact entry point, not a miniature paper. One transformation and one takeaway are usually clearer than a crowded collage of mechanisms, spectra and claims.
TOC Graphics: One Panel, One Reaction Story