Sequence Diagram Generator
Use the sequence diagram generator to show participants exchanging messages over time. Define lifelines, calls, returns and alternative paths, then check the ordering against one concrete scenario.
SEE ACADRAW IN ACTION
Science drawing, from idea to editable figure
Create a science illustration with AI. Refine drawings, build editable diagrams, and convert images to SVG.
Demos play as you scroll into view. Choose a feature to explore.
Trusted by students & researchers from 480+ universities
A global community spanning 60+ countries and regions, from QS top-ranked universities to leading research institutes
























University logos belong to their respective institutions and are shown solely to illustrate our user community. They do not imply any partnership or endorsement.
Tool overview
Explore the use cases, workflow, and key things to know.
Message direction
Name the sender and receiver of every call.
Scenario focus
Explain one interaction before adding alternatives.
Consistent notation
Distinguish calls, returns and asynchronous messages.
Concept reference
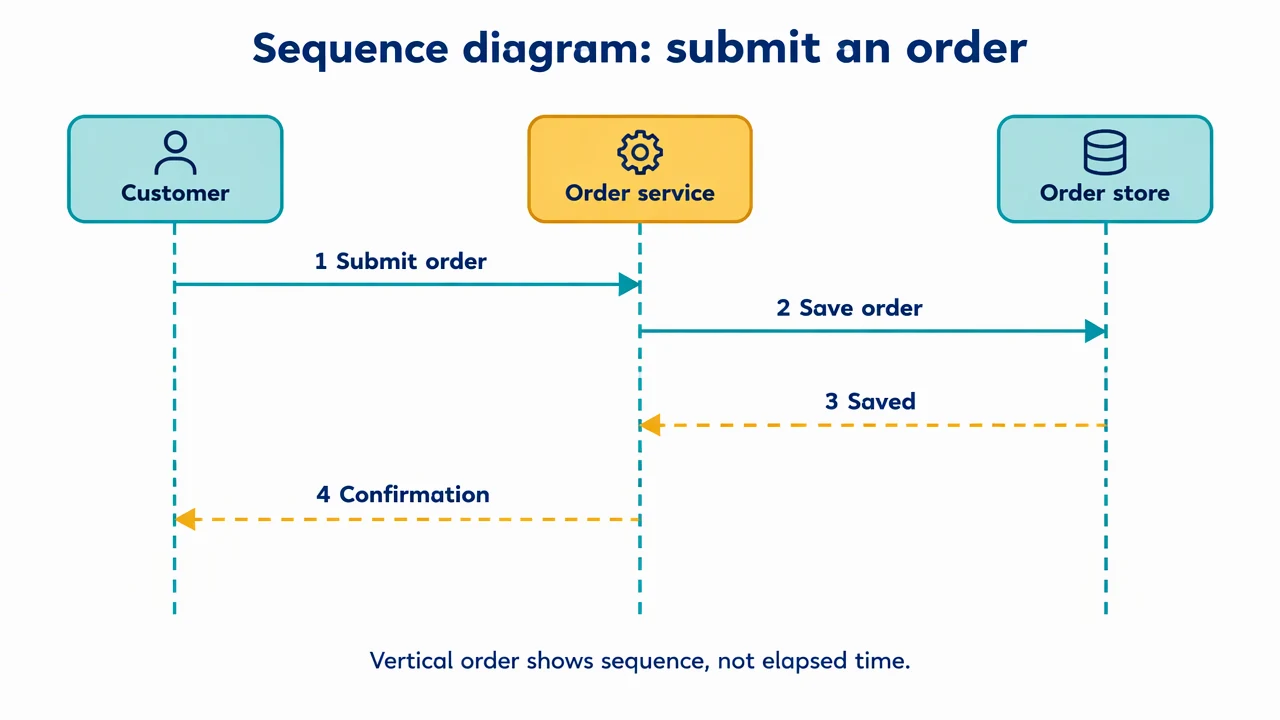
Sequence diagram: submit an order
Three lifelines show a customer submitting an order, a service saving it and a store returning a result. Vertical order represents the interaction sequence rather than measured duration.
Sequence Diagram Generator: reference key
Use the reference and definitions together. On a small screen, scroll the table horizontally.
| Element | Meaning | Review check |
|---|---|---|
| Participant | A role or component in the interaction | Use a consistent abstraction level. |
| Lifeline | The participant timeline | Read events from top to bottom. |
| Call | A message requesting an operation | Place the arrowhead at the receiver. |
| Return | A response to a preceding call | Use the chosen return convention consistently. |
| Activation | An interval of execution on a lifeline | Do not use its height as an unlabelled time measurement. |
| Combined fragment | A region for alternatives, loops or options | State guards and which messages belong inside. |
Sequence Diagram Generator: plan the visual
Use the sequence diagram generator to show participants exchanging messages over time. Define lifelines, calls, returns and alternative paths, then check the ordering against one concrete scenario.
Choose a single interaction scenario
A successful order submission is different from a failed payment or cancellation. Give the sequence diagram generator a trigger, participants and expected outcome before adding alternate paths. Keep deployment details out unless they affect the interaction being explained.
Trace sender and receiver
Each arrow should identify who initiates the message and who receives it. Name calls as operations and returns as results. Vertical placement establishes ordering along a lifeline; it is not automatically a global clock or a performance trace.
Make alternatives conditional
An alt fragment needs meaningful guards such as accepted and rejected, rather than two unrelated stories stacked in one frame. Use loops for repeated messages and consider a separate view if exception handling makes the main scenario unreadable.
Common mistakes to avoid
Using arrows only for visual balance
The arrowhead determines the receiver. Check direction against the written scenario instead of mirroring shapes for symmetry.
Treating vertical spacing as latency
Without an explicit timing model, the diagram illustrates order rather than elapsed time.
Mixing component and user granularity
A user, a method and a physical server can coexist only if their roles are clear. Choose the participant level that serves the explanation.
Sequence Diagram Generator: from brief to draft
Reading the reference is free. Generating a new draft requires an account and available credits. See current pricing.
Choose Science Drawing for an illustrated draft, or Editable Diagram for separate shapes and labels. Review all definitions, labels and connections before sharing.
- 1
Write the message list
Name participants, trigger, ordered calls and expected responses.
- 2
Draft lifelines and messages
Use the sequence diagram generator with explicit senders, receivers and guards.
- 3
Walk through the scenario
Check order, return paths and alternative outcomes against the original list.
Example brief for the sequence diagram generator
Original educational illustration on white, 1280x720 landscape, crisp vector-like editorial style, navy readable English labels, teal and amber accents, generous whitespace. Render all shapes, labels and arrows directly in the image. No third-party artwork, brand, logo, screenshot or measured result. Title 'Sequence diagram: submit an order'. Three participants across top 'Customer', 'Order service', 'Order store'. Dashed vertical lifelines. Four messages in top-to-bottom order: solid arrow Customer to Order service labeled '1 Submit order'; solid arrow Order service to Order store labeled '2 Save order'; dashed arrow Order store to Order service labeled '3 Saved'; dashed arrow Order service to Customer labeled '4 Confirmation'. Use right direction for each message, no crossing labels. Footer 'Vertical order shows sequence, not elapsed time'.
Use this prompt in the generatorSequence Diagram Generator: common questions
What does the sequence diagram generator produce?
It drafts a message-based interaction view from a written scenario, with participants and ordered communication.
Can I show asynchronous messages?
Yes. Specify asynchronous behavior and verify that arrow styles and responses match the chosen notation.
Does it execute or trace my application?
No. Supply the scenario or verified trace details; the page does not inspect a running application.
How does this differ from a data flow diagram?
A sequence diagram emphasizes interaction order. A DFD emphasizes information transformations and stores without specifying execution order.
Sources and editorial notes
Prepared by the AcaDraw product team. Source and diagram check: . This is a simplified educational model; independent expert review has not been completed. AI-generated drafts need checking against reliable references.
Explore the sequence diagram guide
Three lifelines show a customer submitting an order, a service saving it and a store returning a result. Vertical order represents the interaction sequence rather than measured duration.
Sequence Diagrams: Lifelines, Messages, and Alternatives