Data Flow Diagram Generator
Use the data flow diagram generator to map external entities, processes, data stores and named flows. Describe what information moves through the system, then review the diagram level and boundary.
SEE ACADRAW IN ACTION
Science drawing, from idea to editable figure
Create a science illustration with AI. Refine drawings, build editable diagrams, and convert images to SVG.
Demos play as you scroll into view. Choose a feature to explore.
Trusted by students & researchers from 480+ universities
A global community spanning 60+ countries and regions, from QS top-ranked universities to leading research institutes
























University logos belong to their respective institutions and are shown solely to illustrate our user community. They do not imply any partnership or endorsement.
Tool overview
Explore the use cases, workflow, and key things to know.
Describe the system boundary
List external actors, major transformations, stored information and exchanged data.
Draft one DFD level
Use the data flow diagram generator with a notation key and named directional flows.
Trace every interface
Check parent-child balance, input/output plausibility and missing data sources.
Concept reference
Data flow diagram: an order system
A simple order-processing example connects a customer, one process and an order store. Named arrows describe information rather than timing or control flow.
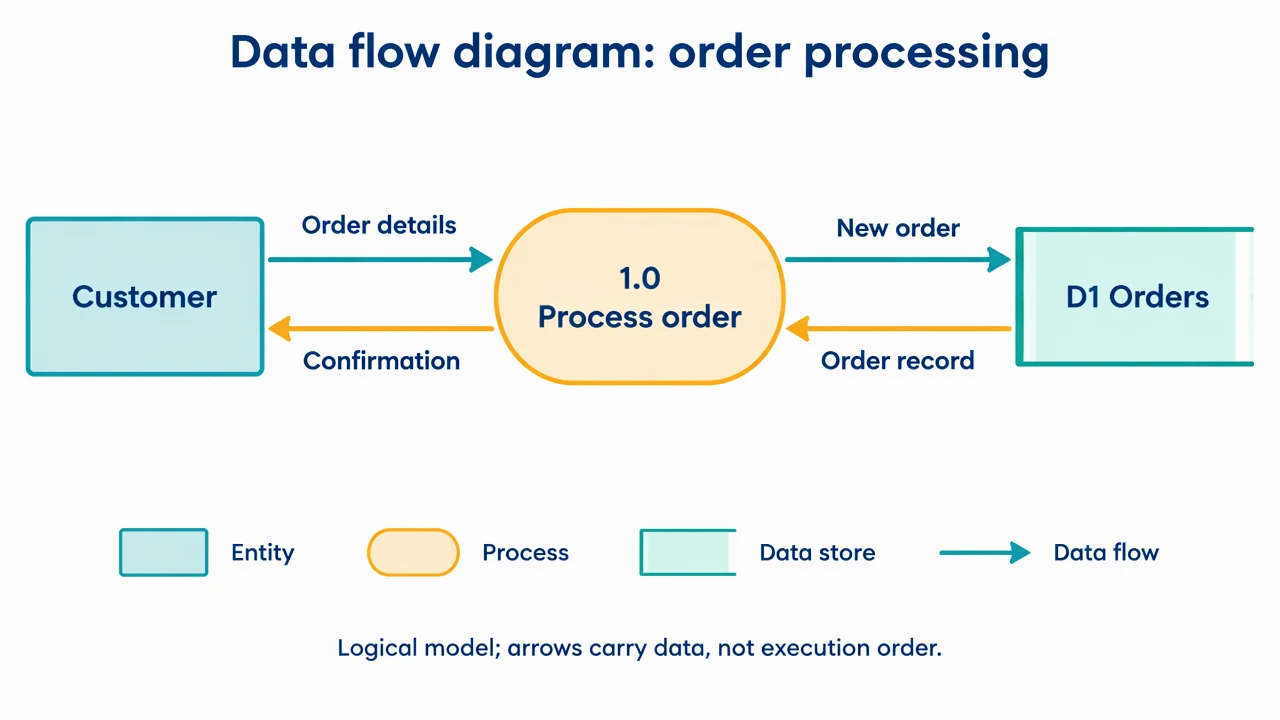
Data Flow Diagram Generator: reference key
Use the reference and definitions together. On a small screen, scroll the table horizontally.
| Element | Meaning | Review check |
|---|---|---|
| External entity | A source or destination outside the system | Keep it outside the chosen system boundary. |
| Process | An activity transforming information | Use a verb phrase and identify inputs and outputs. |
| Data store | Information retained for later use | Name the logical collection rather than a particular server unless needed. |
| Data flow | A named information transfer | Label with a noun phrase describing the data. |
| Context diagram | A single-process view of the whole system | Show external interfaces without internal decomposition. |
| Level-1 diagram | A decomposition into major internal processes | Balance external flows with the parent context view. |
Data Flow Diagram Generator: plan the visual
Use the data flow diagram generator to map external entities, processes, data stores and named flows. Describe what information moves through the system, then review the diagram level and boundary.
Choose context or decomposition
A context diagram treats the system as one process. Level 1 opens that process into major transformations and stores. Use the data flow diagram generator for one level at a time so readers do not confuse an external organization with an internal component.
Name what crosses each arrow
Order details, confirmation and stored order record are different information flows. Use noun phrases for arrows and verb phrases for processes. A DFD is about data transformation; execution order belongs in a flowchart or sequence diagram.
Balance the parent and child views
When a process is decomposed, its incoming and outgoing external flows should remain accounted for. Check for data that disappears, output without a source and flows that bypass processes directly between an entity and a store.
Common mistakes to avoid
Using flowchart decisions
A diamond for an if/else branch changes the notation and intent. Keep control logic in a separate flowchart.
Drawing direct entity-to-store access
In a logical DFD, a process should mediate the interaction. Show the transformation instead of connecting every box directly.
Leaving arrows unlabeled
An arrow without a data name cannot explain the interface. Label each direction separately when request and response differ.
Data Flow Diagram Generator: from brief to draft
Reading the reference is free. Generating a new draft requires an account and available credits. See current pricing.
Choose Science Drawing for an illustrated draft, or Editable Diagram for separate shapes and labels. Review all definitions, labels and connections before sharing.
- 1
Describe the system boundary
List external actors, major transformations, stored information and exchanged data.
- 2
Draft one DFD level
Use the data flow diagram generator with a notation key and named directional flows.
- 3
Trace every interface
Check parent-child balance, input/output plausibility and missing data sources.
Example brief for the data flow diagram generator
Original educational scientific illustration on white, 1280x720 landscape. Crisp vector-like editorial artwork, navy text, teal and amber accents, generous whitespace, large legible English labels. All structures, labels and connecting arrows rendered by the image model. No third-party artwork, logo, photograph, experimental measurement or numerical performance claim. Title 'Data flow diagram: order processing'. Left rectangle 'Customer'. Center rounded process '1.0 Process order'. Right open-ended data store 'D1 Orders'. Named arrows: Customer to process 'Order details'; process to Customer 'Confirmation'; process to store 'New order'; store to process 'Order record'. Ensure arrowheads and labels clearly match those four directions. Bottom key 'Entity / Process / Data store / Data flow'. Footer 'Logical model; arrows carry data, not execution order'. No extra connectors, database rows or chart.
Use this prompt in the generatorData Flow Diagram Generator: common questions
What does the data flow diagram generator create?
It drafts a logical model of information moving between entities, processes and stores from your system description.
Is a DFD the same as a flowchart?
No. A DFD tracks information and transformations, while a flowchart usually shows execution steps and decisions.
Can I make a context diagram?
Yes. Ask for one system process and its external entities. Create internal decomposition as a separate view.
Does it analyze a database or upload a dataset?
No. This page drafts structure from a description. It does not analyze records or create charts from data tables.
Sources and editorial notes
Prepared by the AcaDraw product team. Source and diagram check: . This is a simplified educational model; independent expert review has not been completed. AI-generated drafts need checking against reliable references.
Explore the data flow diagram guide
A simple order-processing example connects a customer, one process and an order store. Named arrows describe information rather than timing or control flow.
Data Flow Diagrams: Processes, Stores, and Boundaries