Plot Diagram Maker
Use a plot diagram maker to organize the major beats of a story. Keep exposition, conflict, turning point and resolution distinct, while treating the shape as a planning aid rather than a rule that every narrative must follow.
SEE ACADRAW IN ACTION
Science drawing, from idea to editable figure
Create a science illustration with AI. Refine drawings, build editable diagrams, and convert images to SVG.
Demos play as you scroll into view. Choose a feature to explore.
Trusted by students & researchers from 480+ universities
A global community spanning 60+ countries and regions, from QS top-ranked universities to leading research institutes
























University logos belong to their respective institutions and are shown solely to illustrate our user community. They do not imply any partnership or endorsement.
Tool overview
Explore the use cases, workflow, and key things to know.
Name the story scope
Identify the story, chapter or scene the diagram describes.
Separate events from interpretation
Place concrete events on the arc, then explain why they change the conflict or stakes.
Allow different structures
Use the organizer as a scaffold; do not force every narrative into one five-part shape.
Concept reference
Plot diagram reference: story beats and turning point
This organizer places five common story beats along a rising-and-falling arc. The shape helps learners discuss sequence and tension, but real stories may use nonlinear structure, multiple climaxes or unresolved endings.
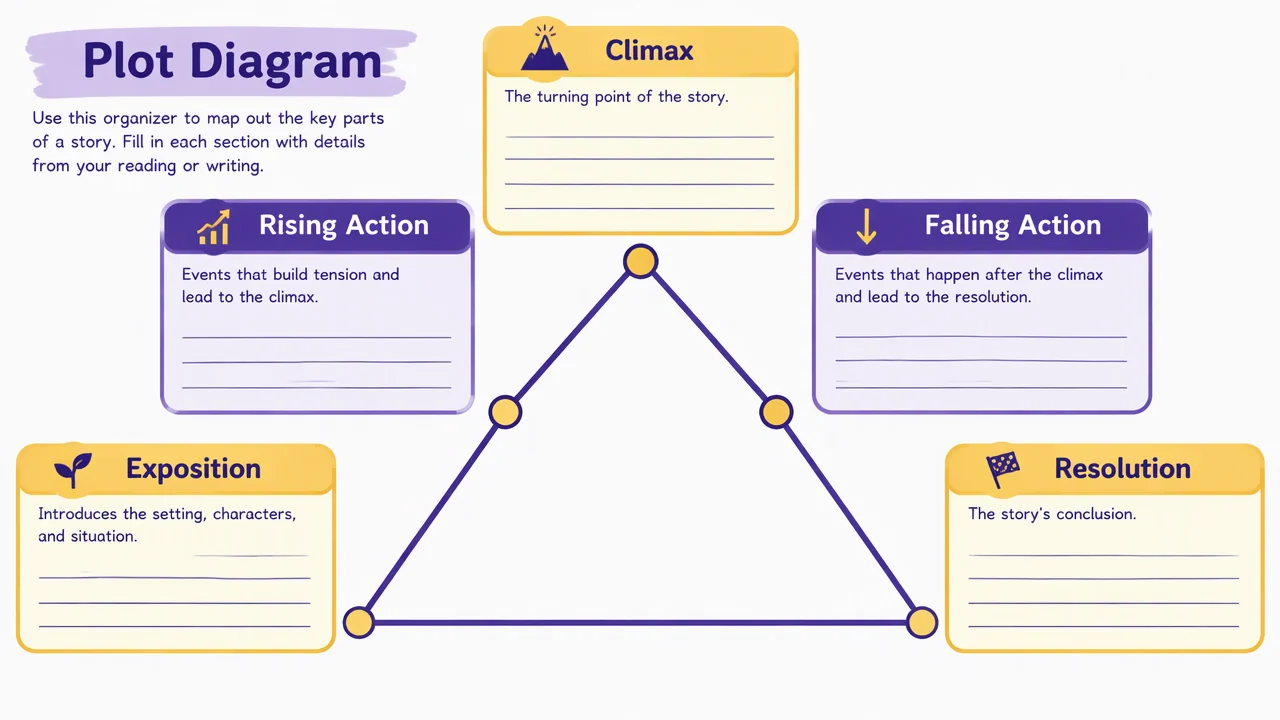
Plot diagram label key
Use the reference and definitions together. On a small screen, scroll the table horizontally.
| Beat | Planning question | Drawing check |
|---|---|---|
| Exposition | Who, where and what situation does the reader need first? | Introduce the setting and central situation without writing the whole summary. |
| Rising action | Which events complicate the central conflict? | Place only turning events that increase stakes or change choices. |
| Climax | What decision or confrontation changes the direction? | Define why this moment is the story’s turning point. |
| Falling action | What consequences follow the turning point? | Connect consequences to the decision rather than adding unrelated events. |
| Resolution | What new situation remains at the end? | A resolution can close, complicate or deliberately leave a question open. |
Make a plot diagram useful for discussion
A plot diagram becomes more than a triangle when each point includes evidence from the text and a reason for its placement.
Sequence is evidence
Use chapter, scene or page references when students need to defend the order.
Conflict drives the arc
The rising action should connect to the central conflict, not a list of every event.
Structure varies
A five-beat organizer is a teaching framework, not a universal law of storytelling.
Common plot diagram mistakes
Event overload
Too many minor events make the turning point impossible to see.
Climax confusion
The most dramatic scene is not always the structural turning point.
Forced resolution
Some stories end with ambiguity; describe what the text actually provides.
Create your own plot diagram diagram
Reading the reference is free. Generating a new draft requires an account and available credits. See current pricing.
Choose Science Drawing for an illustrated draft, or Editable Diagram for separate shapes and labels. Review all definitions, labels and connections before sharing.
- 1
Define the text
Choose a story, chapter or scene and collect the events that matter.
- 2
Place the beats
Add one or two evidence-backed events to each stage.
- 3
Discuss the structure
Explain why the climax changes the direction and note any nonlinear elements.
A prompt you can adapt
Create a clean, editable plot diagram for a fictional short story. Label Exposition, Rising Action, Climax, Falling Action and Resolution on a readable story arc, add short placeholder prompts for setting, conflict, turning point and consequences, and keep the organizer generic.
Use this prompt in the generatorPlot Diagram diagram FAQ
What is a plot diagram?
It is a visual organizer for a story’s setup, complications, turning point, consequences and ending.
Does every story follow the same arc?
No. The five-part arc is a useful classroom scaffold, not a requirement for every narrative.
What belongs at the climax?
The climax is the pivotal decision, confrontation or reversal that changes the direction of the story.
Can I use it for a chapter?
Yes. State the scope so the diagram does not imply that one chapter contains the complete plot.
Can I edit the plot diagram?
Yes. Use Editable Diagram mode to move beats and add evidence or discussion prompts.
Sources and editorial notes
Prepared by the AcaDraw product team. Source and diagram check: . This is a simplified educational model; independent expert review has not been completed. AI-generated drafts need checking against reliable references.
Create a plot diagram diagram for your lesson
Choose the scope, generate a draft, then review labels and connections before sharing.
Plot Diagram Maker: Turn Story Events into a Defensible Arc