Compare and Contrast Graphic Organizer
Create a compare and contrast graphic organizer for two concepts, structures or processes. Use separate regions for topic-specific features and shared features; this page does not calculate data or produce statistical charts.
SEE ACADRAW IN ACTION
Science drawing, from idea to editable figure
Create a science illustration with AI. Refine drawings, build editable diagrams, and convert images to SVG.
Demos play as you scroll into view. Choose a feature to explore.
Trusted by students & researchers from 480+ universities
A global community spanning 60+ countries and regions, from QS top-ranked universities to leading research institutes























University logos belong to their respective institutions and are shown solely to illustrate our user community. They do not imply any partnership or endorsement.
Tool overview
Explore the use cases, workflow, and key things to know.
Name the two topics
State exactly what is being compared before filling the regions.
Keep the overlap meaningful
Put shared properties in the intersection, not items that merely look similar.
Use one idea per note
Short phrases make the organizer easier to scan and edit.
Concept reference
Compare and contrast graphic organizer with two editable circles and a shared overlap
This compare and contrast graphic organizer is a qualitative classroom template. The regions are for user-entered concepts and do not encode counts, percentages or measured data.
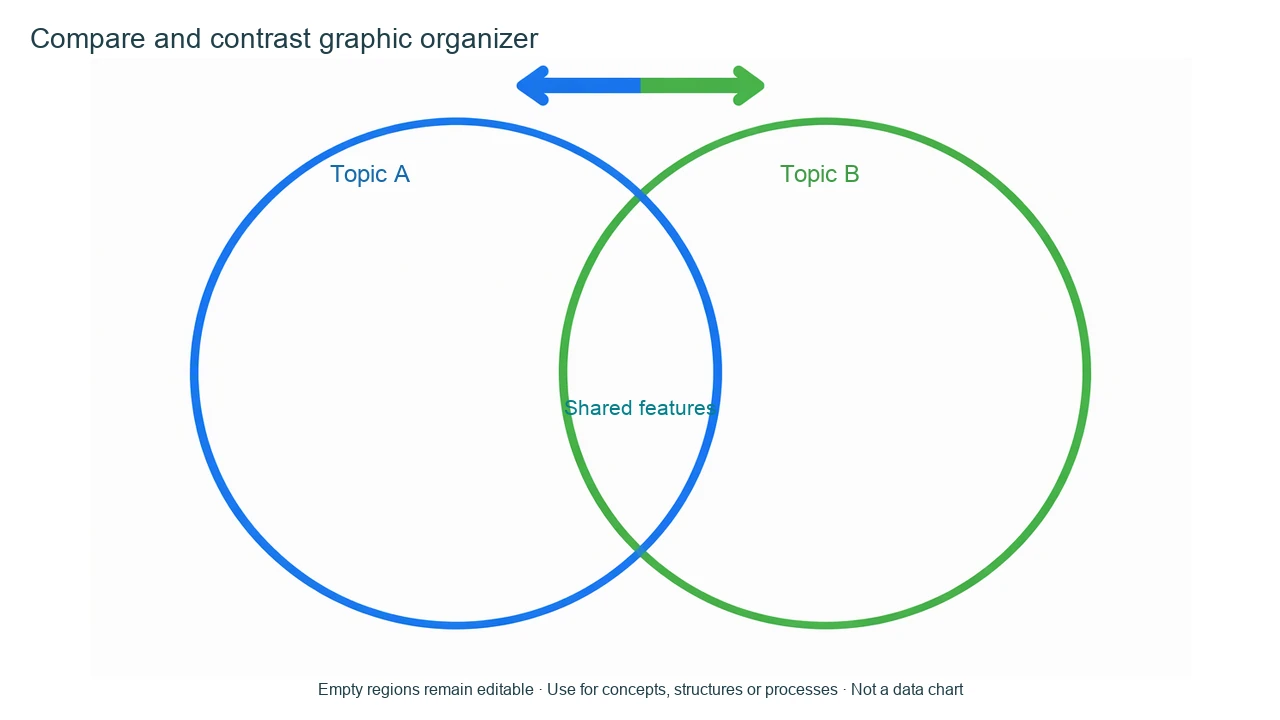
Compare and Contrast reference key
Use the reference and definitions together. On a small screen, scroll the table horizontally.
| Label or stage | Position or relationship | Meaning and drawing check |
|---|---|---|
| Topic A | Left region | Features unique to the first concept, structure or process. |
| Topic B | Right region | Features unique to the second concept, structure or process. |
| Shared features | Overlap | Properties that genuinely apply to both topics. |
| Evidence note | Optional caption or footer | Add a source or definition when the comparison depends on a specific classification. |
Build a comparison that readers can scan
A useful organizer states the comparison question first, then keeps unique and shared properties in consistent regions.
Comparison needs a criterion
Decide whether the comparison concerns structure, function, sequence, cause or another explicit criterion.
Overlap is not a third topic
The intersection should contain shared features, not unrelated extra content.
Templates need a legend
Add definitions or a source when a category could be interpreted in more than one way.
Common compare and contrast mistakes
Filling the overlap with everything
Only shared properties belong in the intersection.
Comparing unlike categories
Make the two topics comparable before drawing the organizer.
Treating circle size as data
The diagram is qualitative; circle area does not represent frequency or magnitude.
Create your own compare and contrast diagram
Reading the reference is free. Generating a new draft requires an account and available credits. See current pricing.
Choose Science Drawing for an illustrated draft, or Editable Diagram for separate shapes and labels. Review all definitions, labels and connections before sharing.
- 1
Set the comparison question
Name the two topics and the criterion that connects them.
- 2
Draft the regions
Place unique and shared points in separate editable text areas.
- 3
Check the logic
Remove items that do not belong to either topic or the intersection.
A prompt you can adapt
Create an editable compare and contrast graphic organizer with two large overlapping circles. Label the regions Topic A, Topic B and Shared features, leave generous writing space and add a small criterion or source note area. Keep the organizer qualitative; do not infer percentages or draw a data chart.
Use this prompt in the generatorCompare and Contrast diagram FAQ
What is a compare and contrast graphic organizer?
It is a visual template for listing features unique to two topics and features they share.
What goes in the overlap?
Only properties that apply to both topics belong in the overlap.
Can the circles represent percentages?
This template is qualitative. Use a data visualization tool when circle size or counts carry numerical meaning.
Can I compare scientific concepts?
Yes. Define the comparison criterion and cite a source when the categories are technical.
Sources and editorial notes
Prepared by the AcaDraw product team. Source and diagram check: . This is a simplified educational model; independent expert review has not been completed. AI-generated drafts need checking against reliable references.
Create a compare and contrast diagram for your lesson
Choose the scope, generate a draft, then review labels and connections before sharing.
Compare and Contrast Graphic Organizer: Shared Features and Differences