Graphic Organizer Maker
Use a graphic organizer maker to arrange a central idea, supporting concepts and evidence. Choose a structure that matches the relationship you want learners to notice, then keep the labels and connectors explicit.
SEE ACADRAW IN ACTION
Science drawing, from idea to editable figure
Create a science illustration with AI. Refine drawings, build editable diagrams, and convert images to SVG.
Demos play as you scroll into view. Choose a feature to explore.
Trusted by students & researchers from 480+ universities
A global community spanning 60+ countries and regions, from QS top-ranked universities to leading research institutes
























University logos belong to their respective institutions and are shown solely to illustrate our user community. They do not imply any partnership or endorsement.
Tool overview
Explore the use cases, workflow, and key things to know.
Define the scope
Choose the view, audience and labels before generating.
Keep relationships explicit
Use readable connectors, boundaries or arrows instead of decorative ambiguity.
Review before sharing
Check spelling, endpoints and claims against reliable references.
Concept reference
Graphic organizer reference: concepts, links and evidence
The organizer starts with a central topic and branches into inputs, stages and outputs. Its boxes and connectors are a qualitative planning structure; they do not represent measured values or a statistical chart.
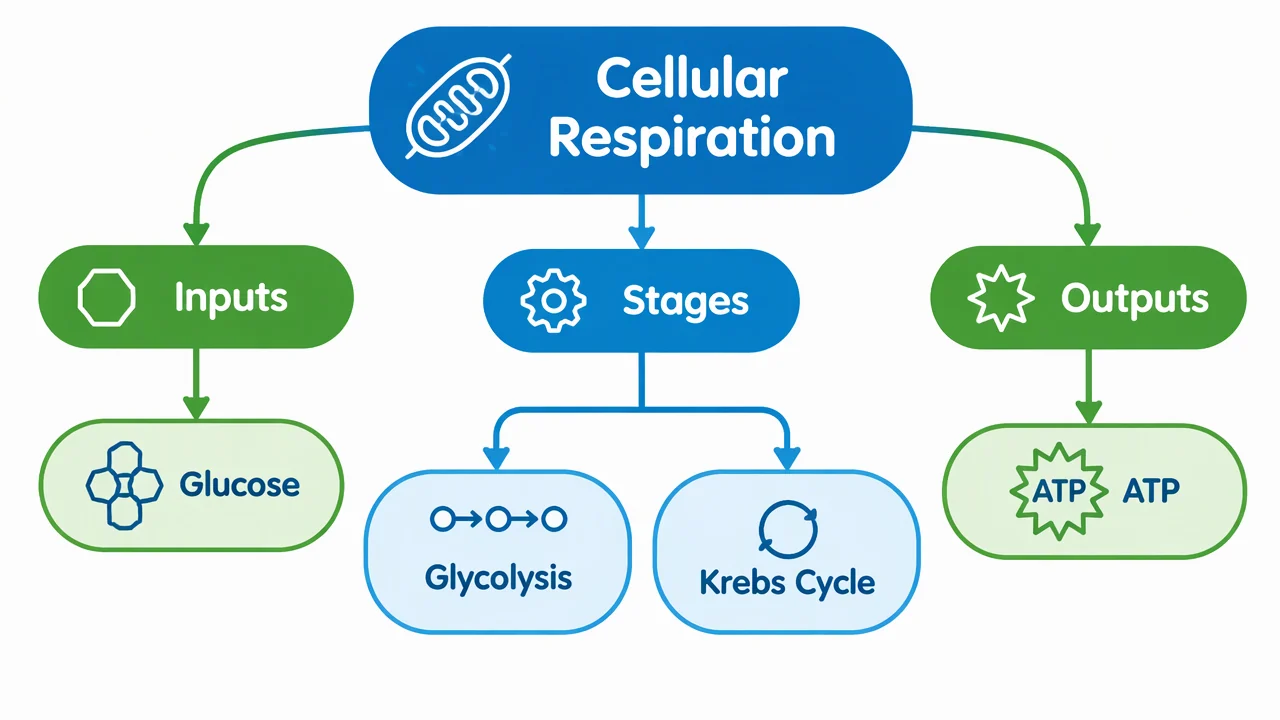
Graphic organizer label key
Use the reference and definitions together. On a small screen, scroll the table horizontally.
| Element | Role | Design check |
|---|---|---|
| Central topic | Names the question or concept being organized. | Keep it specific enough to guide the branches. |
| Category branch | Groups related ideas under a shared heading. | Use parallel wording across branches. |
| Evidence or example | Supports a claim or explains a concept. | Add a source or definition when accuracy matters. |
| Connector | Shows a relationship or sequence. | Use a short verb or arrow label when direction matters. |
Choose a structure that matches the thinking task
Name the central question first, then select branches, sequence, compare-and-contrast regions or a cause-and-effect chain that makes the intended relationship visible.
One organizer, one main job
A focused structure is easier to scan than a page that mixes several unrelated layouts.
Connectors should say something
Use arrows, lines or labels only when they explain a relationship.
Evidence belongs near claims
Place a source, example or definition beside the idea it supports.
Common graphic organizer mistakes
Using a generic web for every task
Choose a tree, sequence, matrix or comparison layout when it fits better.
Leaving arrows unexplained
Label direction or relationship type when a connector could be ambiguous.
Filling every space
Whitespace helps learners add evidence and revise their thinking.
Create your own graphic organizer diagram
Reading the reference is free. Generating a new draft requires an account and available credits. See current pricing.
Choose Science Drawing for an illustrated draft, or Editable Diagram for separate shapes and labels. Review all definitions, labels and connections before sharing.
- 1
Name the thinking task
Decide whether learners need sequence, categories, comparison, causes or evidence.
- 2
Place the main ideas
Use a central topic and parallel branches with short labels.
- 3
Add evidence and revise
Check connectors, sources, reading order and available response space.
A prompt you can adapt
Create a clean, editable graphic organizer for “Cellular Respiration” with a central topic and three branches labeled Inputs, Stages and Outputs. Add glucose, glycolysis, Krebs cycle and ATP as subnodes, use noncrossing connectors and keep it qualitative.
Use this prompt in the generatorGraphic Organizer diagram FAQ
What is a graphic organizer?
It is a visual structure that helps learners arrange concepts, sequence, comparisons or evidence.
Which layout should I choose?
Use a sequence for steps, a matrix for comparisons, a tree for categories and a concept map for many relationship types.
Can a graphic organizer show data?
It can label or discuss data, but this template does not calculate or render a quantitative chart.
Can I edit the generated organizer?
Yes. Use Editable Diagram when you need separate shapes, connectors and labels.
How do I make it accessible?
Use readable contrast, a clear reading order and text alternatives for essential relationships.
Sources and editorial notes
Prepared by the AcaDraw product team. Source and diagram check: . This is a simplified educational model; independent expert review has not been completed. AI-generated drafts need checking against reliable references.
Create a graphic organizer diagram for your lesson
Choose the scope, generate a draft, then review labels and connections before sharing.
Graphic Organizer Maker: Turn Concepts into Clear Relationships