PCR Diagram Generator
Use the PCR diagram generator to explain the three recurring stages of a polymerase chain reaction: denaturation, annealing and extension. Define what the picture should teach before generating it. A PCR diagram can clarify the workflow without claiming that an assay succeeded or prescribing conditions for an unknown template.
SEE ACADRAW IN ACTION
Science drawing, from idea to editable figure
Create a science illustration with AI. Refine drawings, build editable diagrams, and convert images to SVG.
Demos play as you scroll into view. Choose a feature to explore.
Trusted by students & researchers from 480+ universities
A global community spanning 60+ countries and regions, from QS top-ranked universities to leading research institutes
























University logos belong to their respective institutions and are shown solely to illustrate our user community. They do not imply any partnership or endorsement.
Tool overview
Explore the use cases, workflow, and key things to know.
Explain the cycle
Separate strand opening, primer binding and DNA synthesis.
Review strand direction
Do not infer primer polarity from a simplified process icon.
Keep assay claims bounded
A teaching picture does not verify amplification or prescribe an optimized protocol.
Concept reference
PCR Diagram Generator: a worked example
This PCR diagram is a process overview: strands separate, primers anneal and polymerase extends them to produce complementary DNA. The return arrow means the cycle repeats. The illustration omits base sequences and strand-end labels; it is not a primer-design reference or a thermal-cycler program.
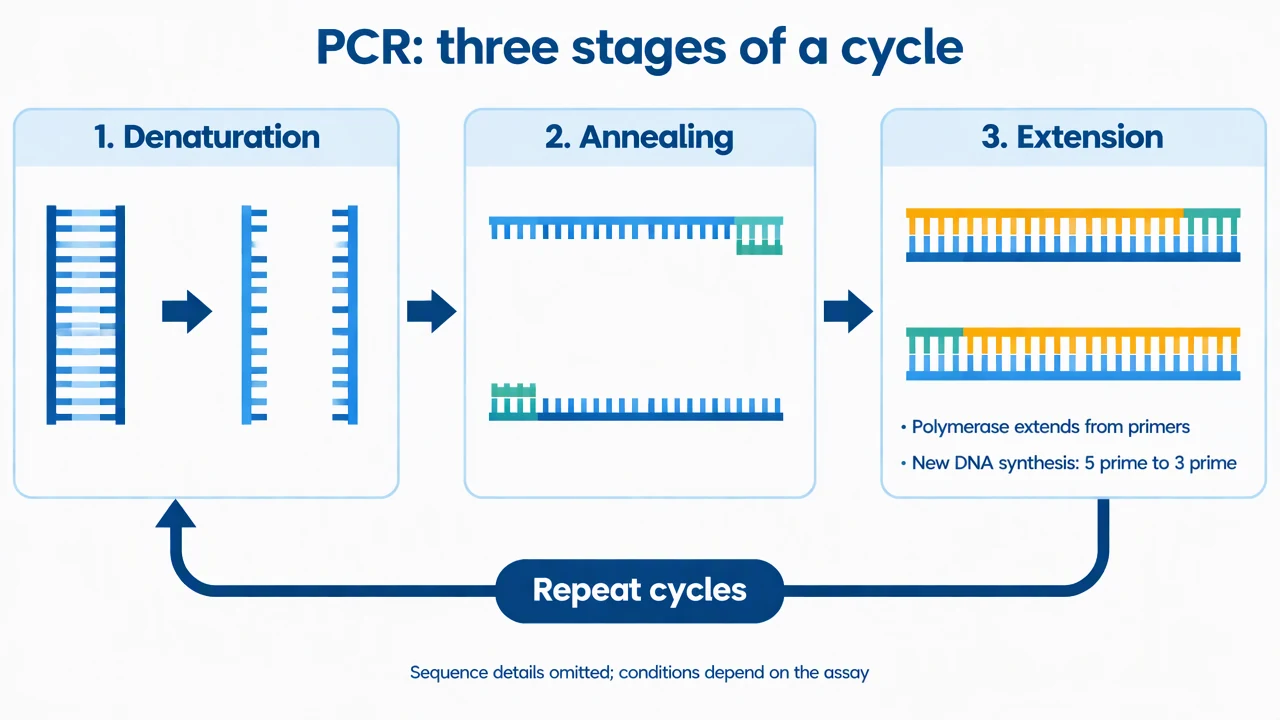
PCR Diagram Generator: reference key
Use the reference and definitions together. On a small screen, scroll the table horizontally.
| Element | Meaning | Review check |
|---|---|---|
| Template | DNA containing the target region | Use the actual sequence when designing an assay; the teaching picture has no base-level detail. |
| Primer pair | Short oligonucleotides defining the target | Primers must bind opposite strands and support extension toward the target region. |
| Denaturation | Separation of paired DNA strands | Distinguish strand separation from cutting the DNA backbone. |
| Annealing | Primer binding to complementary template | Suitable conditions depend on the primer pair and assay. |
| Extension | Polymerase synthesis from a primed template | New DNA grows 5′ to 3′ from the primer’s 3′ end. |
| Cycle repeat | The recurring workflow | Idealized amplification is not a guarantee of real reaction efficiency. |
PCR Diagram Generator: plan the content
A PCR diagram should distinguish the repeating cycle from the underlying strand chemistry. Show primer placement clearly, and remember that new DNA synthesis proceeds from a primer’s 3′ end in the 5′ to 3′ direction.
Choose workflow or strand detail
A PCR diagram can teach stage order or primer orientation. Use a dedicated sequence-level figure when the latter is the actual learning goal.
State the role of primers
Polymerase extends an existing primer. A picture that starts new synthesis on a bare template omits a crucial requirement.
Separate conventional PCR and readout
Endpoint PCR, quantitative PCR and reverse-transcription workflows require different explanations. Name the technique rather than using their labels interchangeably.
Common mistakes in a pcr diagram
Drawing new DNA in the wrong direction
Both new strands grow 5′ to 3′ even though their templates have opposite orientations. Review a sequence-level drawing carefully.
Presenting one temperature set as universal
Primer sequence, polymerase and target influence assay conditions. The PCR diagram intentionally omits a fixed program.
Treating a cycle icon as proof of success
A schematic shows the intended workflow. Specific amplification and contamination controls require real assay evidence.
PCR Diagram Generator: from brief to reviewed draft
Reading the reference is free. Generating a new draft requires an account and available credits. See current pricing.
Choose Science Drawing for an illustrated draft, or Editable Diagram for separate shapes and labels. Review all definitions, labels and connections before sharing.
- 1
Choose the teaching scope
Tell the PCR diagram generator whether you need a stage overview, a primer-orientation view or a labeled assay workflow.
- 2
Generate a bounded PCR diagram
Name the relevant stages and omit unverified temperatures, sequences or outcome claims.
- 3
Review before teaching or sharing
Check the cycle order and any strand labels against reliable sources; include the limits of the simplified PCR diagram.
Example brief for a pcr diagram
Create a PCR diagram with denaturation, annealing and extension connected in order, plus a return arrow for repeated cycles. Use separate template and primer colors, keep the primer positions consistent between annealing and extension, and state that new DNA grows 5′ to 3′. This is a process overview; omit base sequences, end labels, universal temperatures and experimental results.
Use this prompt in the generatorPCR Diagram Generator: common questions
What does the PCR diagram generator create?
It creates an educational illustration or editable workflow from your description. It does not design primers or validate an assay.
What are the three recurring PCR stages?
Denaturation separates strands, annealing allows primers to bind, and extension allows polymerase to synthesize DNA from the primers.
Which direction does new DNA grow?
DNA polymerase adds to a primer’s 3′ end, so the new strand grows 5′ to 3′. The overview illustration omits sequence-level end labels.
Does the PCR diagram generator provide assay temperatures?
No universal program is supplied. Use validated conditions appropriate to the polymerase, primers and target.
Does the PCR diagram prove a positive result?
No. The image describes a process and contains no gel, amplification curve or measured assay output.
Sources and editorial notes
Prepared by the AcaDraw product team. Source and diagram check: . This is a simplified educational model; independent expert review has not been completed. AI-generated drafts need checking against reliable references.
Read the pcr diagram guide
A PCR diagram should distinguish the repeating cycle from the underlying strand chemistry. Show primer placement clearly, and remember that new DNA synthesis proceeds from a primer’s 3′ end in the 5′ to 3′ direction.
PCR Diagrams: Denaturation, Annealing, and Extension