Experimental Design Diagram Generator
An experimental design diagram makes the planned comparison visible. Use this generator to arrange groups, interventions, controls and measurement points, then review the design with the protocol and research team.
SEE ACADRAW IN ACTION
Science drawing, from idea to editable figure
Create a science illustration with AI. Refine drawings, build editable diagrams, and convert images to SVG.
Demos play as you scroll into view. Choose a feature to explore.
Trusted by students & researchers from 480+ universities
A global community spanning 60+ countries and regions, from QS top-ranked universities to leading research institutes
























University logos belong to their respective institutions and are shown solely to illustrate our user community. They do not imply any partnership or endorsement.
Tool overview
Explore the use cases, workflow, and key things to know.
State the question
Name the comparison, population and primary measurement.
Map the groups
Show control, treatment, timing and planned measurements.
Review the protocol
Check controls, confounders, randomization or blocking and analysis plan with the team.
Concept reference
Experimental design: a worked reference
The teaching example shows a fictional plant study with Control and Treatment groups, a baseline measurement, an intervention and a final measurement. The diagram is a plan, not a result.
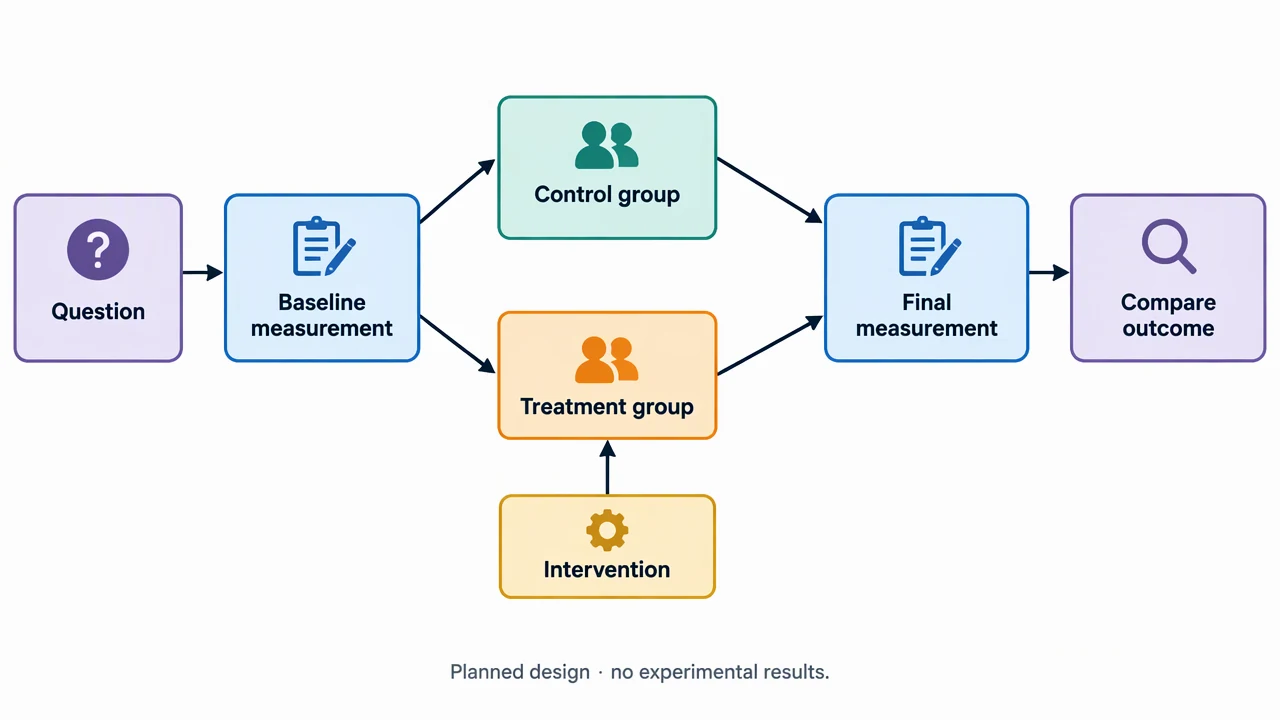
Experimental design element key
Use the reference and definitions together. On a small screen, scroll the table horizontally.
| Element | Meaning | Review check |
|---|---|---|
| Research question | The comparison the design is meant to address | Keep the outcome and population in scope. |
| Independent variable | Condition the researcher changes or compares | Define levels and timing in the protocol. |
| Control | Reference condition for interpretation | Explain what the control holds constant. |
| Measurement point | When and how an outcome is recorded | Name units, instrument and planned timing. |
| Confounder | A factor that could explain the difference | Plan how it will be balanced, blocked or discussed. |
Plan your experimental design diagram
A design diagram describes what is planned. It does not prove that the design is valid, calculate power, randomize participants or generate experimental results.
Show the comparison
The reader should see which groups differ and which features are held constant.
Separate plan from result
Use future or planned language until measurements exist and have been analyzed.
Mark review gates
Protocol approval, pilot checks and data-quality review can be visible without claiming success.
Common mistakes to avoid
Confusing control and no treatment
A control condition must be defined; it may receive a vehicle, sham or standard comparison.
Skipping baseline
If baseline matters, show when it is measured and how it informs the comparison.
Adding outcome numbers
A design diagram should not contain invented means, p-values or effect sizes.
Experimental Design Diagram Generator: from brief to checked draft
Reading the reference is free. Generating a new draft requires an account and available credits. See current pricing.
Choose Science Drawing for an illustrated draft, or Editable Diagram for separate shapes and labels. Review all definitions, labels and connections before sharing.
- 1
State the question
Name the comparison, population and primary measurement.
- 2
Map the groups
Show control, treatment, timing and planned measurements.
- 3
Review the protocol
Check controls, confounders, randomization or blocking and analysis plan with the team.
A prompt you can adapt
Create an original educational experimental design diagram on a clean white landscape canvas. Show Question, Baseline measurement, split into Control group and Treatment group, Intervention only in Treatment, Final measurement, and Compare outcome. Add a footer Planned design · no experimental results. Use clear arrows and labels, no participant counts, percentages, charts, logos or fabricated findings. Render exact English labels.
Use this prompt in the generatorExperimental Design Diagram FAQ
What does an experimental design diagram show?
It summarizes the planned groups, variables, controls, timing and measurements for an experiment.
Does it calculate sample size?
No. It does not perform power analysis or determine a valid sample size.
Can it randomize participants?
No. Randomization and allocation should follow the approved protocol and actual study process.
Can I add results later?
Yes, keep the planned design separate from a results figure and label any later measurements from the verified analysis.
Sources and editorial notes
Prepared by the AcaDraw product team. Source and diagram check: . This is a simplified educational model; independent expert review has not been completed. AI-generated drafts need checking against reliable references.
Explore the experimental design diagram guide
A design diagram describes what is planned. It does not prove that the design is valid, calculate power, randomize participants or generate experimental results.
Experimental Design Diagram: Variables, Controls, and Review Gates