Moon Phases Diagram Generator
Create a moon phases diagram that explains how sunlight produces the visible sequence from new moon to full moon and back. Keep orbit geometry and apparent illumination distinct from a calendar prediction.
SEE ACADRAW IN ACTION
Science drawing, from idea to editable figure
Create a science illustration with AI. Refine drawings, build editable diagrams, and convert images to SVG.
Demos play as you scroll into view. Choose a feature to explore.
Trusted by students & researchers from 480+ universities
A global community spanning 60+ countries and regions, from QS top-ranked universities to leading research institutes























University logos belong to their respective institutions and are shown solely to illustrate our user community. They do not imply any partnership or endorsement.
Tool overview
Explore the use cases, workflow, and key things to know.
Follow the illumination
Sunlight comes from one direction, so each position exposes a different visible fraction.
Name waxing and waning
Waxing increases the illuminated fraction; waning decreases it.
Separate phase from position
A phase is an appearance from Earth, not a claim about the Moon’s current sky position.
Concept reference
Moon phases diagram: eight lunar phases around Earth with sunlight from the right
This moon phases diagram uses eight schematic positions around Earth. The orbit, spacing and lunar size are not to scale; the key idea is which fraction of the sunlit half is visible from Earth.
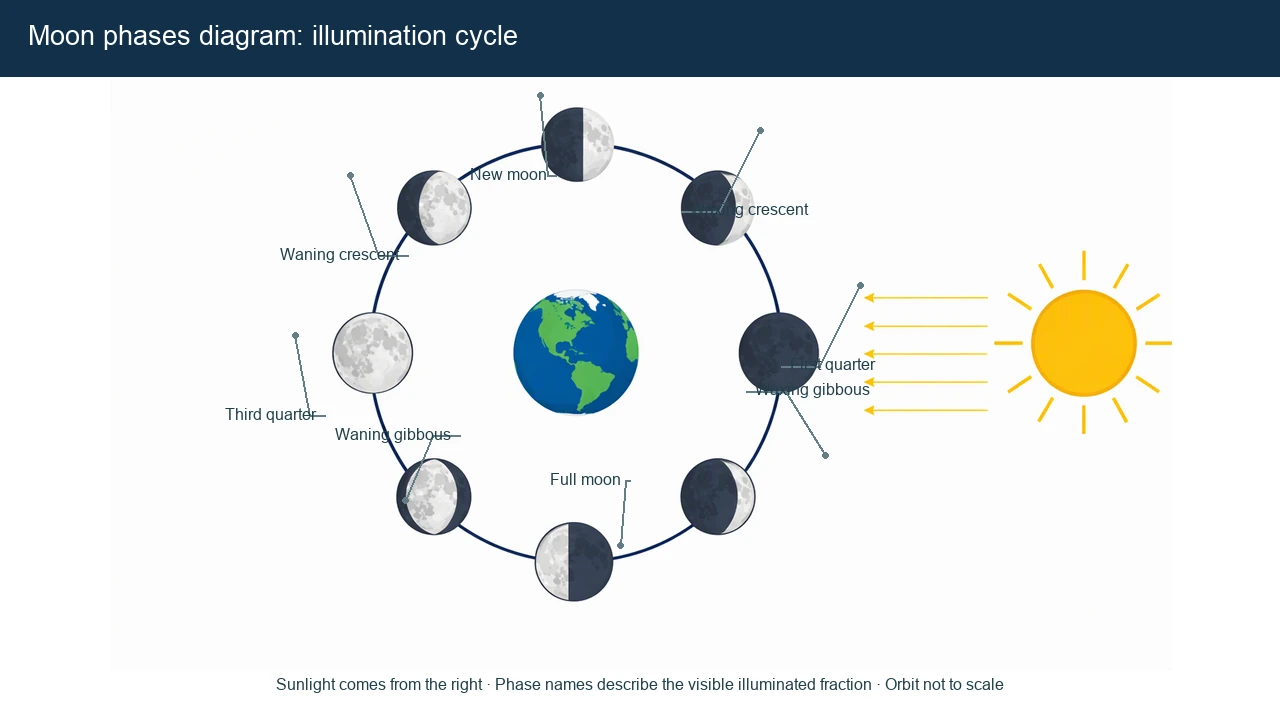
Moon Phases reference key
Use the reference and definitions together. On a small screen, scroll the table horizontally.
| Label or stage | Position or relationship | Meaning and drawing check |
|---|---|---|
| New moon | Moon between Earth and Sun in the simplified view | The near side is mostly unlit from Earth; it may be difficult to see. |
| First quarter | About one-half illuminated and increasing | Quarter refers to the lunar cycle position, not the visible fraction. |
| Full moon | Earth between Sun and Moon in the simplified view | The near side is mostly illuminated; exact alignment is not implied. |
| Third quarter | About one-half illuminated and decreasing | It follows the waning gibbous phase in this eight-step model. |
| Waxing | Illuminated fraction grows | Use the arrow direction and visible fraction together. |
| Waning | Illuminated fraction shrinks | Waning does not mean the Moon produces less light; it reflects viewing geometry. |
Read the moon phases diagram as a viewing-geometry model
The sequence is easiest to understand when the Sun’s fixed direction and the observer on Earth stay explicit.
Sunlight is always present
Half of the Moon is illuminated at any moment; the visible fraction changes with position.
The sequence repeats
A lunar phase cycle is periodic, while the exact sky position depends on time and location.
Not a calendar
A generic diagram does not calculate dates, rise times or local visibility.
Common moon phases mistakes
Drawing phases as eclipses
Most phases do not require perfect alignment; eclipses are separate events.
Calling quarter a quarter-lit Moon
Quarter describes cycle position; the visible face is roughly half illuminated.
Using orbit spacing as a measurement
The illustration compresses distances to keep all phases visible.
Create your own moon phases diagram
Reading the reference is free. Generating a new draft requires an account and available credits. See current pricing.
Choose Science Drawing for an illustrated draft, or Editable Diagram for separate shapes and labels. Review all definitions, labels and connections before sharing.
- 1
Set the light source
Put the Sun and direction of light on the page before adding phase labels.
- 2
Arrange the sequence
Use eight positions and make the visible illuminated fraction easy to compare.
- 3
Add a scope note
Mark the figure as a geometry lesson, not a current-sky forecast.
A prompt you can adapt
Create a labeled moon phases diagram with the Sun to the right, Earth in the center and eight evenly spaced lunar positions. Show new, crescent, quarter, gibbous and full phases in order, with waxing and waning arrows. State that orbit, spacing and size are schematic and do not calculate a calendar.
Use this prompt in the generatorMoon Phases diagram FAQ
What causes moon phases?
Moon phases result from the changing fraction of the Moon’s sunlit half that is visible from Earth as the Moon orbits.
Is the Moon producing its own light?
No. Moonlight is reflected sunlight.
What is the difference between waxing and waning?
Waxing means the visible illuminated fraction is growing; waning means it is shrinking.
Is a quarter moon half illuminated?
The visible face is roughly half illuminated, while “quarter” refers to the Moon’s cycle position.
Is this diagram to scale?
No. The orbit, Moon size and spacing are schematic.
Sources and editorial notes
Prepared by the AcaDraw product team. Source and diagram check: . This is a simplified educational model; independent expert review has not been completed. AI-generated drafts need checking against reliable references.
Create a moon phases diagram for your lesson
Choose the scope, generate a draft, then review labels and connections before sharing.
Moon Phases Diagram: New, Crescent, Quarter, Gibbous, and Full