Layers of the Earth Diagram Generator
Create a layers of the Earth diagram with four clearly labeled compositional regions. Distinguish rocky crust and mantle from the metallic core, identify the liquid outer core, and keep mechanical layers in a separate comparison.
SEE ACADRAW IN ACTION
Science drawing, from idea to editable figure
Create a science illustration with AI. Refine drawings, build editable diagrams, and convert images to SVG.
Demos play as you scroll into view. Choose a feature to explore.
Trusted by students & researchers from 480+ universities
A global community spanning 60+ countries and regions, from QS top-ranked universities to leading research institutes























University logos belong to their respective institutions and are shown solely to illustrate our user community. They do not imply any partnership or endorsement.
Tool overview
Explore the use cases, workflow, and key things to know.
Read one classification at a time
Use crust, mantle and core for composition; introduce lithosphere separately for mechanical behavior.
Identify solid and liquid regions
Keep the rocky mantle mostly solid and the metallic outer core liquid in the introductory model.
Build a teaching draft
Adapt the layers of the Earth diagram to a label exercise, cutaway or comparison lesson.
Concept reference
Layers of the Earth diagram: crust, mantle, and two core regions
This layers of the Earth diagram uses a simplified concentric section. The crust is exaggerated so it remains visible. The mantle is mostly solid rock that can deform slowly, the outer core is liquid metal, and the inner core is solid. The illustration is qualitative, not a measured depth or temperature profile.
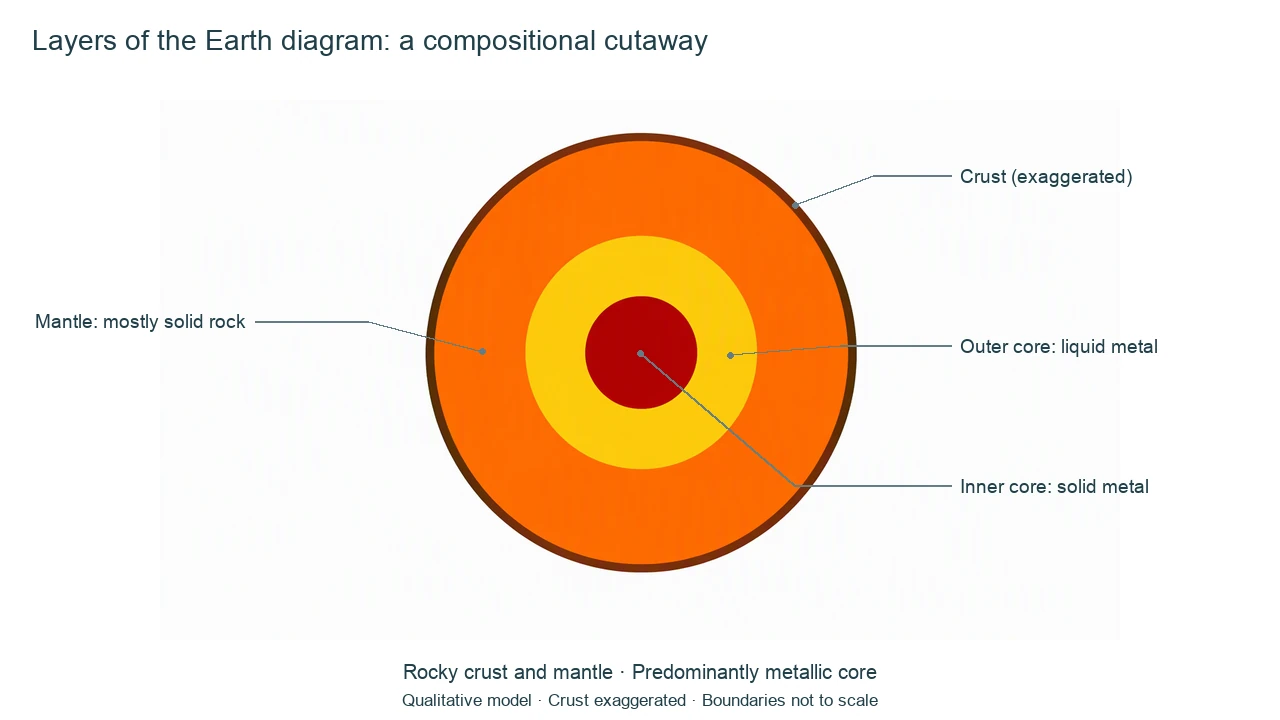
Layers of the Earth diagram label key
Use the reference and definitions together. On a small screen, scroll the table horizontally.
| Label or process | Position or relationship | Meaning and drawing check |
|---|---|---|
| Crust | Thin outer rocky shell | Oceanic and continental crust differ in composition and thickness; the visible band is exaggerated. |
| Mantle | Rock between crust and core | Mostly solid silicate rock that can deform and flow over geological time; not a global magma ocean. |
| Outer core | Metallic region surrounding the inner core | Liquid, predominantly iron alloy. Motion of conducting fluid contributes to Earth's magnetic field. |
| Inner core | Central metallic region | Solid under very high pressure, despite high temperature. Not a hollow cavity. |
| Core–mantle boundary | Between rocky mantle and metallic outer core | A compositional boundary, not the boundary between crust and mantle. |
| Lithosphere | Crust plus rigid uppermost mantle | A mechanical category that crosses the crust–mantle compositional boundary; shown in a separate explanation. |
Two ways to read a layers of the Earth diagram
A layers of the Earth diagram can classify material or mechanical behavior. Avoid stacking the names from both systems as if they were one list of separate shells.
Composition asks what it is made of
Crust and mantle are rocky; the core is predominantly metallic. Splitting the core highlights its liquid and solid regions.
Mechanical behavior asks how it responds
Lithosphere includes crust and rigid uppermost mantle. Asthenosphere is a weaker, deformable region beneath it, not a synonym for the whole mantle.
Depth needs an explicit scale
Layer thickness varies, especially in the crust. Add distances only when the source, units and radial scale are defined.
Common layers of the earth diagram mistakes
Making the mantle entirely liquid
Slow deformation of solid rock is different from a planet-wide ocean of molten magma.
Treating lithosphere as crust alone
Lithosphere also includes rigid uppermost mantle; it belongs to a different classification.
Reading the colored bands as measured thickness
This layers of the Earth diagram exaggerates the crust and uses schematic boundaries.
Create your own layers of the earth diagram
Reading the reference is free. Generating a new draft requires an account and available credits. See current pricing.
Choose Science Drawing for an illustrated draft, or Editable Diagram for separate shapes and labels. Review all definitions, labels and connections before sharing.
- 1
Choose the classification
Start with a compositional layers of the Earth diagram before adding mechanical behavior.
- 2
Specify the cutaway
Ask for a concentric section with four named regions and one legend.
- 3
Check the material states
Review mantle, outer-core and inner-core labels before using the figure.
A prompt you can adapt
Create a labeled layers of the Earth diagram as a qualitative circular cutaway. Show a thin exaggerated rocky crust, a thick mostly solid rocky mantle, a liquid metallic outer core and a solid metallic inner core. Use one compositional classification. If adding lithosphere and asthenosphere, put them in a separate mechanical comparison inset, not extra shells in the same four-layer list. White background, readable noncrossing labels, no invented depth or temperature values, not to scale.
Use this prompt in the generatorLayers of the Earth diagram FAQ
What are the four main layers of the Earth diagram labels?
Crust, mantle, outer core and inner core form the common four-region school model. The last two divide the metallic core by physical state.
Is the mantle liquid?
The mantle is mostly solid rock. It can deform over long times and contains partial melt in some settings, but it is not entirely molten.
Why is the outer core liquid and the inner core solid?
Pressure and temperature together determine physical state. Conditions in the outer core permit liquid metal; extreme central pressure supports a solid inner core.
Is lithosphere the same as crust?
No. Lithosphere includes the crust and rigid uppermost mantle. It is a mechanical classification.
Is this layers of the Earth diagram to scale?
No. The crust is exaggerated for readability, and the illustration does not provide a measured depth profile.
Can I create an editable layers of the Earth diagram?
Yes. Choose Editable Diagram for separate shapes and labels or Science Drawing for an illustrated draft. Generation requires an account and credits; review the result.
Sources and editorial notes
Prepared by the AcaDraw product team. Source and diagram check: . This is a simplified educational model; independent expert review has not been completed. AI-generated drafts need checking against reliable references.
Create a layers of the earth diagram for your lesson
Choose the scope, generate a draft, then review labels and connections before sharing.
Layers of the Earth Diagram: Crust, Mantle, and Core Explained