Water Cycle Diagram Generator
Use this labeled water cycle diagram to follow water between the ocean, atmosphere, land and groundwater. Check the processes, then create a diagram for your lesson or worksheet.
SEE ACADRAW IN ACTION
Science drawing, from idea to editable figure
Create a science illustration with AI. Refine drawings, build editable diagrams, and convert images to SVG.
Demos play as you scroll into view. Choose a feature to explore.
Trusted by students & researchers from 480+ universities
A global community spanning 60+ countries and regions, from QS top-ranked universities to leading research institutes























University logos belong to their respective institutions and are shown solely to illustrate our user community. They do not imply any partnership or endorsement.
Tool overview
Explore the use cases, workflow, and key things to know.
Every arrow has a process
Separate evaporation and transpiration from precipitation and returning water.
More than a four-step loop
Include surface and underground routes without implying that every drop follows the same path.
Create a teaching draft
Adapt the prompt to your class, then check and refine the labels and connections.
Labeled water cycle reference
Follow the stores and transfers, not a fixed sequence
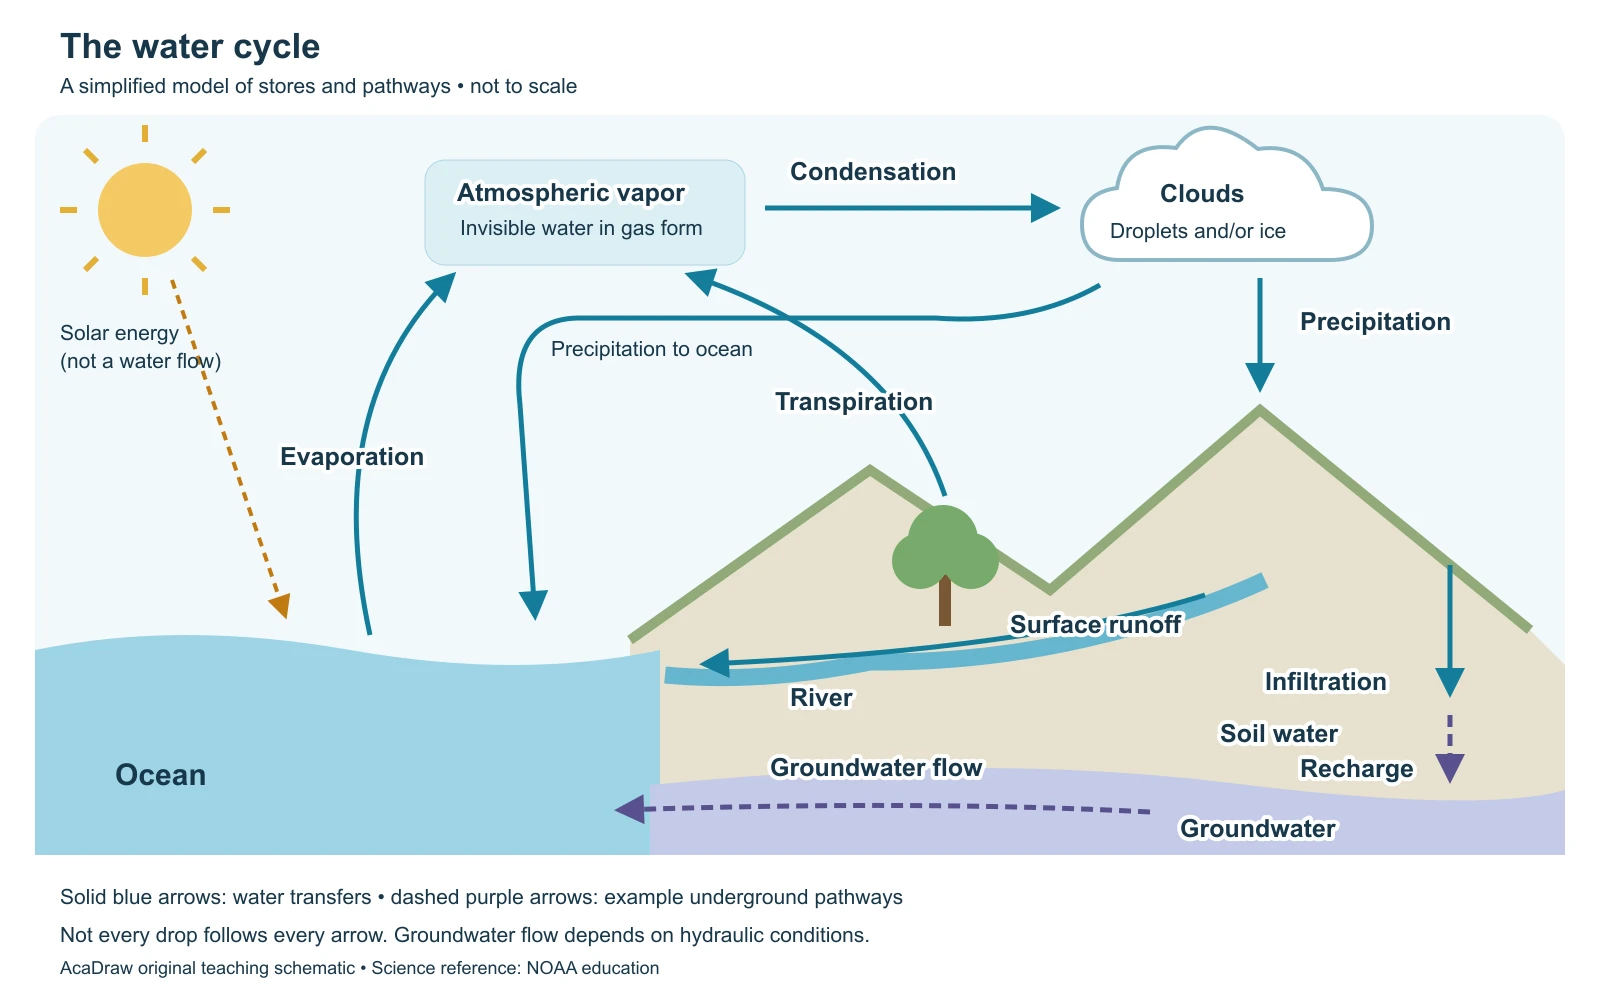
The water cycle, also called the hydrologic cycle, describes water moving among stores on, above and below Earth’s surface. This simplified model separates liquid water, atmospheric water vapor and cloud droplets, and includes both surface and underground return paths.
Ocean and surface water
Oceans, rivers and lakes store liquid water. Surface water can evaporate; rivers and groundwater can return water to the ocean.
Atmospheric water
Water vapor is an invisible gas. Clouds contain tiny liquid droplets and/or ice crystals formed as moist air cools and water condenses or deposits.
Land, soil and groundwater
Water on land can run off, enter soil, be taken up by plants or recharge saturated groundwater. These routes depend on terrain, soil, geology and moisture conditions.
Water cycle processes
Check the direction and meaning of each arrow
Read each connection as a source, a process and a destination. Sunlight supplies energy for evaporation; gravity helps move precipitation, runoff and groundwater along their paths.
| From | Process | To / what changes |
|---|---|---|
| Surface water | Evaporation | Atmosphere as water vapor; liquid becomes gas. |
| Plants | Transpiration | Atmosphere as water vapor released mainly through leaves. |
| Atmospheric water vapor | Condensation | Liquid cloud droplets; cooling can bring air to saturation. Clouds may also contain ice. |
| Cloud droplets or ice | Precipitation | Land or ocean as rain, snow or other forms of precipitation. |
| Land surface | Surface runoff | Streams, rivers, lakes or ocean; surface water moves downslope. |
| Land surface | Infiltration | Water enters soil; entry alone does not mean it reaches the water table. |
| Soil water | Recharge | Water moves down through the unsaturated zone and reaches groundwater. |
| Groundwater | Groundwater flow and discharge | Water can move to a stream, spring or ocean where hydraulic conditions permit. |
This is a qualitative teaching model. Arrow widths do not encode volumes, speeds or measured fluxes. Groundwater can also receive water from a losing stream; not every underground route leads directly to the ocean.
Read the model carefully
Three distinctions that make the diagram accurate
Clouds are not water vapor
The gas is invisible. A visible cloud is made of droplets and/or ice crystals. Put evaporation on the route into atmospheric vapor and condensation on the route from vapor into droplets.
Infiltration is not the same as recharge
Infiltration is entry into the soil. Some infiltrated water returns through evaporation or plant use. Only the portion reaching the saturated zone becomes groundwater recharge.
There is no universal number of stages
A four-stage school summary is a useful simplification, not the complete water cycle. A drop can be stored, recycled locally or follow different surface and underground routes.
How it works
Create your own water cycle diagram
Reading the reference is free. Generating an AI draft requires an account and available credits. See current pricing.
Choose Science Drawing for an illustrated draft, or Editable Diagram for separate shapes and text. Check the processes and arrow directions in either mode before export.
- 1
Choose the scope
For a first lesson, show ocean, vapor, clouds, rain and a return path. Add plants, soil, groundwater or frozen stores only when they serve the learning objective.
- 2
Generate and check
Use the prefilled prompt, then trace every arrow. Keep sunlight separate from water transfers and make the underground route visibly different from surface runoff.
- 3
Refine and export
Correct the labels and endpoints, add a simplification note, and export your reviewed draft. Duplicate it without labels if you need a worksheet and separate answer key.
A prompt you can adapt
Create a clean educational water cycle diagram on a white background. Show an ocean, atmosphere, clouds, land, plants, a river and groundwater. Draw separate labeled directional arrows: evaporation from surface water to atmospheric water vapor; transpiration from plants to atmospheric vapor; condensation from vapor into cloud droplets; precipitation from clouds to land and ocean; surface runoff from land to a river and ocean; infiltration into soil; recharge downward to groundwater; and groundwater flow toward a stream or ocean where conditions permit. Show sunlight as an energy input, not a water transfer. Explain that cloud droplets are liquid water or ice, not visible water vapor. State that the diagram is simplified and not to scale; it omits some stores and human activities. Use readable labels and distinct arrowheads. In Editable Diagram mode, keep shapes and text separate for manual review.
Use this prompt in the generatorWater cycle diagram FAQ
What are the main stages of the water cycle?
Evaporation, condensation, precipitation and collection are a common introductory summary. A fuller diagram also shows transpiration, runoff, infiltration, groundwater recharge and discharge, plus ice-related pathways and human activities. There is no single universal stage count.
What is the difference between evaporation and condensation?
Evaporation changes liquid water into water vapor. Condensation changes vapor into liquid droplets. Water vapor is invisible; the droplets and ice crystals in a cloud scatter light and make it visible.
What is transpiration in a water cycle diagram?
Transpiration is the release of water vapor by plants, mainly through leaves. Together with evaporation from land and water surfaces, it contributes to evapotranspiration. Its arrow goes from vegetation toward atmospheric water vapor.
Does all rain become surface runoff?
No. Precipitation may fall into water bodies, be intercepted by vegetation, infiltrate soil, accumulate as snow or ice, or become surface runoff. The fractions vary with conditions.
What is the difference between infiltration and groundwater recharge?
Infiltration is water entering soil at the land surface. Recharge is water reaching the saturated groundwater zone. Some infiltrated water remains in soil or returns to the atmosphere, so the terms are not interchangeable.
What drives the water cycle?
Solar energy supplies much of the energy for evaporation, while gravity moves precipitation and helps drive surface and underground flow. Pressure differences and winds also influence atmospheric water transport.
Can I make a blank water cycle diagram?
Yes. Create and check your own labeled draft, duplicate it, and replace labels with numbered pointers. Keep a separate answer key and retain any required source credit.
Can AcaDraw generate an editable water cycle diagram?
Yes. Describe your diagram in the generator above and choose Editable Diagram for separate shapes and labels. Sign-in and available credits are required. Review every process, arrow and label before using the draft.
Sources and editorial notes
Prepared by the AcaDraw product team. The original figure and explanations were checked against NOAA educational material and NASA Global Precipitation Measurement resources. This is an introductory teaching model, not a measured water budget or a complete hydrological model.
Source and diagram check:
- NOAA — The Water Cycle — Water stores, processes, energy and the complexity of the full cycle.
- NASA GPM — The Water Cycle — Atmospheric transport, precipitation and the return of water to land and oceans.
Make the water cycle diagram your lesson needs
Choose the stores and processes, generate a draft, and check the science before sharing.
Create a water cycle diagramHow to Draw a Water Cycle Diagram
A five-step drawing guide, process checks and a printable review checklist.