Metabolic Pathway Diagram Generator
Use the metabolic pathway diagram generator to organize metabolites, reaction directions and energy-carrier changes into a readable visual draft. Define the pathway boundary and organism first. A metabolic pathway diagram explains selected transformations; it does not calculate flux or turn an imagined route into measured metabolism.
SEE ACADRAW IN ACTION
Science drawing, from idea to editable figure
Create a science illustration with AI. Refine drawings, build editable diagrams, and convert images to SVG.
Demos play as you scroll into view. Choose a feature to explore.
Trusted by students & researchers from 480+ universities
A global community spanning 60+ countries and regions, from QS top-ranked universities to leading research institutes
























University logos belong to their respective institutions and are shown solely to illustrate our user community. They do not imply any partnership or endorsement.
Tool overview
Explore the use cases, workflow, and key things to know.
Follow the carbon
Check that summarized products preserve the intended carbon accounting.
Explain the yield basis
Distinguish ATP used, ATP formed and ATP gained per stated substrate.
Avoid inferred flux
Keep arrow thickness qualitative unless verified quantitative evidence is supplied.
Concept reference
Metabolic Pathway Diagram Generator: a worked example
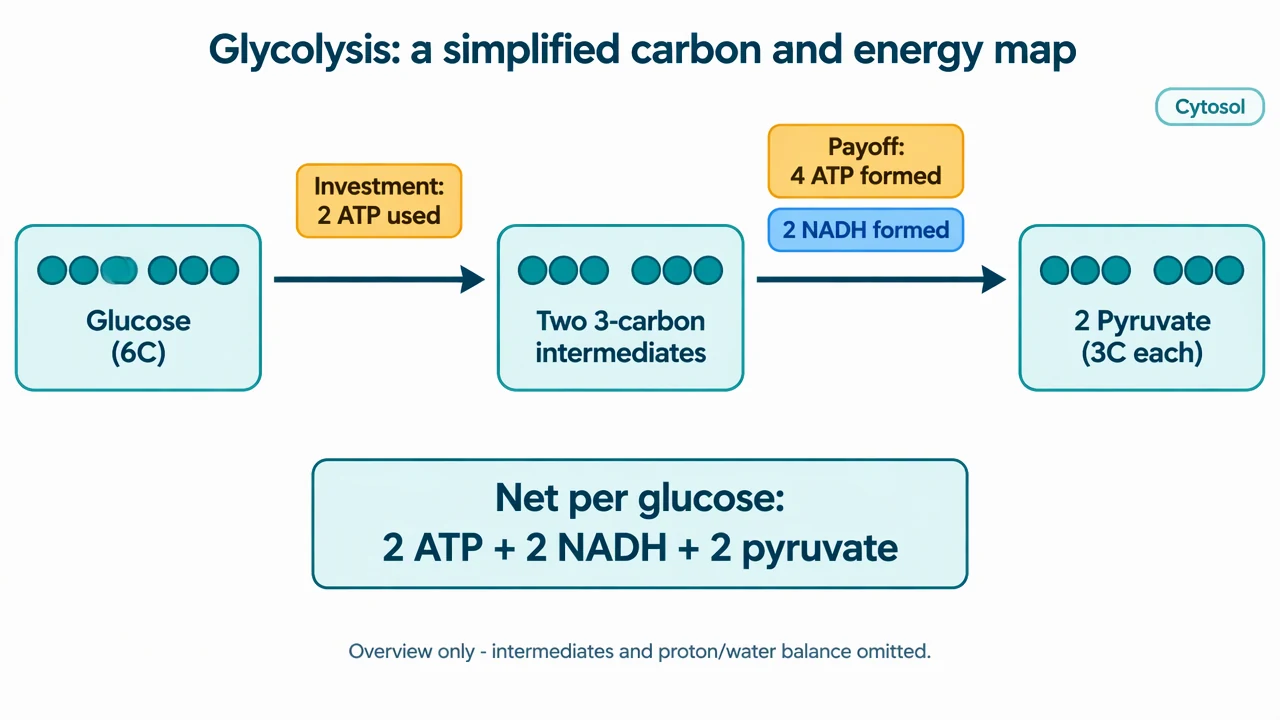
The metabolic pathway diagram summarizes glycolysis in the cytosol. One six-carbon glucose yields two three-carbon pyruvates; the conventional overview uses two ATP during investment and forms four ATP and two NADH during payoff, giving two net ATP per glucose. Detailed intermediates and proton/water balance are omitted.
Metabolic Pathway Diagram Generator: reference key
Use the reference and definitions together. On a small screen, scroll the table horizontally.
| Element | Meaning | Review check |
|---|---|---|
| Metabolite | A chemical participant | Use consistent identities, protonation conventions and abbreviations. |
| Reaction edge | A selected chemical conversion | State whether the edge summarizes several omitted reactions. |
| Enzyme | A catalyst for a particular step | Do not use an enzyme name as if it were a metabolite. |
| Energy carrier | ATP, NADH or another coupled participant | Separate gross production from net yield and state the basis. |
| Compartment | The location of the pathway segment | Show transport explicitly when a boundary is crossed. |
| Flux | Rate of flow through reactions | A reference drawing does not establish rates or measured activity. |
Metabolic Pathway Diagram Generator: plan the content
A metabolic pathway diagram follows chemical matter and energy carriers. Distinguish metabolite conversion from regulation, and separate a simplified overview from a balanced reaction-by-reaction map.
Fix the pathway boundary
A metabolic pathway diagram can show one reaction, a pathway or a network. State which reactions and transport events are outside the boundary.
Label reversibility carefully
Use source-supported direction conventions. A double arrow does not mean the forward and reverse rates are equal under all conditions.
Separate the map from the experiment
Measured abundance, enzyme activity and metabolic flux are different quantities. Do not infer one from another in the visual.
Common mistakes in a metabolic pathway
Reporting gross ATP as net ATP
The four ATP formed in the glycolytic payoff phase do not mean four net ATP. Two ATP were invested earlier.
Using a pathway arrow as a rate measurement
An arrow means a stated relationship or conversion. Without an explicit measurement, its width and color must not imply flux.
Skipping compartment context
Moving a metabolite between compartments may require transport. A metabolic pathway diagram should not silently connect incompatible locations.
Metabolic Pathway Diagram Generator: from brief to reviewed draft
Reading the reference is free. Generating a new draft requires an account and available credits. See current pricing.
Choose Science Drawing for an illustrated draft, or Editable Diagram for separate shapes and labels. Review all definitions, labels and connections before sharing.
- 1
Define metabolites and accounting
Tell the metabolic pathway diagram generator the route, organism, compartment and whether the picture is an overview or detailed scheme.
- 2
Draft the transformations
Name metabolite nodes, reaction directions, enzymes and any carrier annotations you actually need.
- 3
Check the metabolic pathway diagram
Review carbon accounting, net yields, direction conventions and omitted reactions against the chosen reference.
Example brief for a metabolic pathway
Create a simplified glycolysis metabolic pathway diagram in the cytosol. Show glucose with six carbons, two three-carbon intermediates and two three-carbon pyruvates. Annotate two ATP invested, four ATP formed and two NADH formed per glucose, with net gain of two ATP. State that detailed intermediates and proton/water balance are omitted. Do not imply measured flux.
Use this prompt in the generatorMetabolic Pathway Diagram Generator: common questions
What does the metabolic pathway diagram generator produce?
It produces a visual draft from your description. It does not calculate flux, validate a metabolic network or analyze experimental metabolomics data.
Is the glycolysis reference a balanced equation?
No. It is a carbon-and-energy overview. Intermediates and proton/water balance are deliberately omitted.
Why are four ATP formed but only two net ATP gained?
In conventional glycolysis, two ATP are consumed in investment and four are formed in payoff per glucose, leaving a net gain of two.
Can the metabolic pathway diagram generator show branching?
Yes. Specify each branch and its meaning. Do not imply a measured split of flux unless actual evidence supports it.
How is a metabolic pathway diagram different from a signaling map?
A metabolic map emphasizes chemical transformations of metabolites. A signaling map emphasizes information transfer and regulation.
Sources and editorial notes
Prepared by the AcaDraw product team. Source and diagram check: . This is a simplified educational model; independent expert review has not been completed. AI-generated drafts need checking against reliable references.
Read the metabolic pathway guide
A metabolic pathway diagram follows chemical matter and energy carriers. Distinguish metabolite conversion from regulation, and separate a simplified overview from a balanced reaction-by-reaction map.
Metabolic Pathway Diagrams: Carbon, Energy, and Compartments