Krebs Cycle Diagram Generator
Create a Krebs cycle diagram that follows acetyl-CoA entry, two carbon-loss steps and regeneration of oxaloacetate. Read the yield per turn before converting it to a per-glucose total.
SEE ACADRAW IN ACTION
Science drawing, from idea to editable figure
Create a science illustration with AI. Refine drawings, build editable diagrams, and convert images to SVG.
Demos play as you scroll into view. Choose a feature to explore.
Trusted by students & researchers from 480+ universities
A global community spanning 60+ countries and regions, from QS top-ranked universities to leading research institutes






















University logos belong to their respective institutions and are shown solely to illustrate our user community. They do not imply any partnership or endorsement.
Tool overview
Explore the use cases, workflow, and key things to know.
Eight intermediates
Follow citrate through oxaloacetate regeneration with carbon counts.
Per-turn yield
Separate reduced carriers, carbon dioxide and substrate-level phosphorylation.
Respiration context
Keep pyruvate oxidation and electron transport outside the Krebs cycle diagram.
Labeled teaching reference
Krebs Cycle Diagram: labeled teaching reference
This Krebs cycle diagram shows a simplified citric acid cycle in a eukaryotic mitochondrial context. Each turn accepts one two-carbon acetyl group. It separates pyruvate oxidation from the cycle and shows substrate-level phosphorylation as GTP or ATP depending on context.
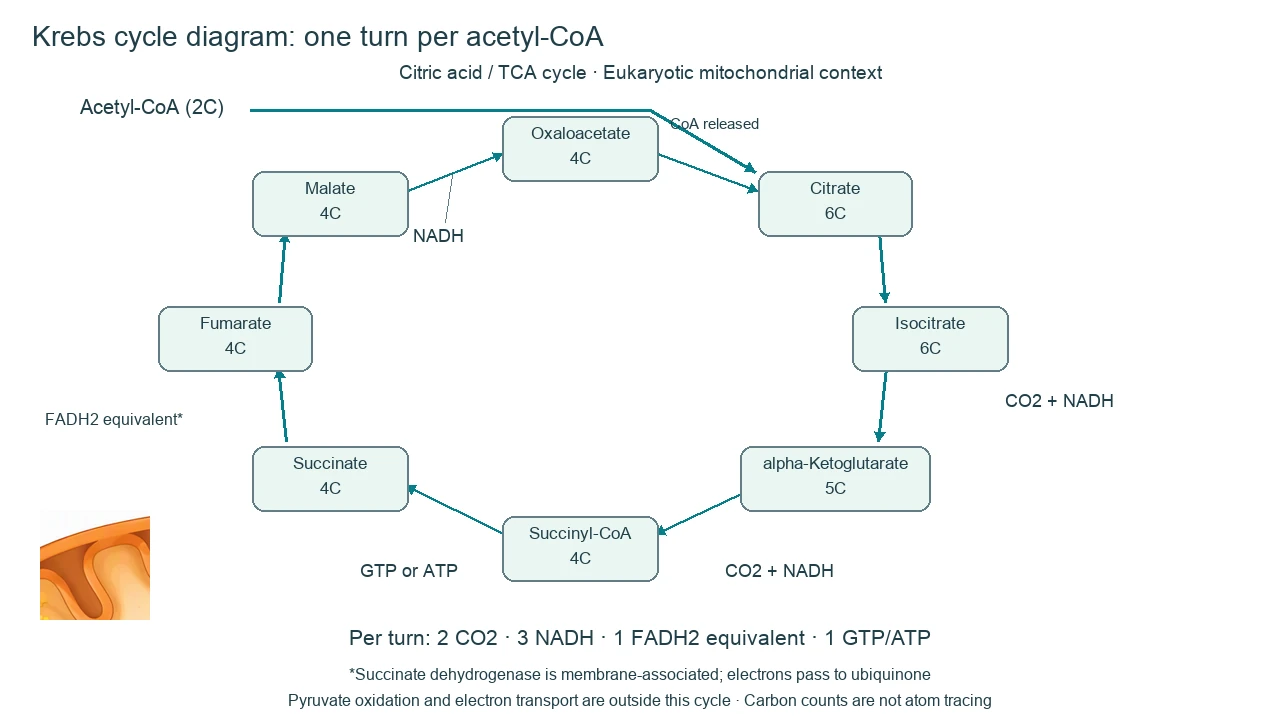
Krebs Cycle Diagram label key
Use the labels with the reference, then choose the detail level your lesson needs. On a small screen, scroll the table horizontally.
| Label or stage | Position or relationship | Meaning and drawing check |
|---|---|---|
| Citrate synthase | Oxaloacetate (4C) + acetyl-CoA (2C) → citrate (6C) | CoA is released; acetyl entry is distinct from pyruvate oxidation. |
| Aconitase | Citrate (6C) → isocitrate (6C) | An isomerization; no carbon loss shown. |
| Isocitrate dehydrogenase | Isocitrate (6C) → alpha-ketoglutarate (5C) | Produces CO2 and NADH in the standard teaching model. |
| Alpha-ketoglutarate dehydrogenase | Alpha-ketoglutarate (5C) → succinyl-CoA (4C) | Produces another CO2 and NADH. |
| Succinyl-CoA synthetase | Succinyl-CoA (4C) → succinate (4C) | Substrate-level phosphorylation produces GTP or ATP, depending on enzyme context. |
| Succinate dehydrogenase | Succinate (4C) → fumarate (4C) | Membrane-associated enzyme; electrons pass through FAD to ubiquinone. FADH2 is common yield shorthand. |
| Fumarase | Fumarate (4C) → malate (4C) | Hydration reaction; no CO2 release. |
| Malate dehydrogenase | Malate (4C) → oxaloacetate (4C) | Produces NADH and regenerates the acceptor for another turn. |
Read the krebs cycle diagram in context
Use a Krebs cycle diagram to distinguish the molecules in the cycle, the products of one turn and the wider respiratory pathway.
Read the yield per turn
A Krebs cycle diagram summarizes two CO2, three NADH, one FADH2 equivalent and one GTP/ATP per acetyl-CoA. These are not all direct ATP.
Keep the eukaryotic location qualified
Most cycle reactions occur in the matrix; succinate dehydrogenase is associated with the inner membrane. Prokaryotes have a different cellular context.
Link the cycle to respiration
The Krebs cycle diagram is one part of respiration. Reduced carriers feed electron transport; oxygen is not a direct cycle substrate.
Common krebs cycle diagram mistakes
Counting pyruvate oxidation twice
Its CO2 and NADH are produced before cycle entry and are not included in the per-turn yield.
Writing the yield as per glucose
One glucose commonly supplies two acetyl groups, so two turns are counted if both enter the cycle.
Making oxygen a direct input arrow
Oxygen accepts electrons in aerobic electron transport, supporting carrier regeneration; it is not directly consumed by cycle enzymes.
Create your own krebs cycle diagram
Reading the reference is free. Generating a new draft requires an account and available credits. See current pricing.
Choose Science Drawing for an illustrated draft, or Editable Diagram for separate shapes and text labels. Review the science and all connections before using either result.
- 1
Set the scope
Choose the view, audience and labels for your krebs cycle diagram. Keep advanced detail in separate panels.
- 2
Generate a focused draft
Use the prompt as a starting point. Separate labels, structures and arrows so the diagram remains readable.
- 3
Review before sharing
Check every label, connection and model assumption against the sources. Keep an answer key for a blank worksheet.
A prompt you can adapt
Create a Krebs cycle diagram with oxaloacetate 4C plus acetyl-CoA 2C forming citrate 6C, then isocitrate 6C, alpha-ketoglutarate 5C, succinyl-CoA 4C, succinate 4C, fumarate 4C, malate 4C and regenerated oxaloacetate 4C. Mark two CO2-release steps, three NADH-producing steps, succinate oxidation as one FADH2 equivalent, and one GTP or ATP. Put pyruvate oxidation and ETC outside the cycle. State yield per acetyl-CoA turn, mitochondrial matrix context with inner-membrane succinate dehydrogenase exception. Use separate readable labels.
Use this prompt in the generatorKrebs cycle diagram FAQ
Are Krebs cycle and citric acid cycle the same?
Yes. The names Krebs cycle, citric acid cycle and TCA cycle refer to the same core pathway in this context.
Where does the Krebs cycle occur?
In eukaryotes most cycle enzymes are in the mitochondrial matrix. Succinate dehydrogenase is associated with the inner membrane; prokaryotes lack mitochondria.
What is produced per turn?
The standard summary is two CO2, three NADH, one FADH2 equivalent and one GTP or ATP per acetyl-CoA turn, with oxaloacetate regenerated.
How many turns occur per glucose?
Complete oxidation of one glucose typically supplies two acetyl-CoA, giving two cycle turns. State the counting basis explicitly.
Does the cycle directly use oxygen?
No molecular oxygen is directly consumed by the cycle. Aerobic electron transport uses oxygen and regenerates oxidized carriers.
Does newly entered acetyl carbon leave immediately as CO2?
Do not infer that from a simple carbon-count diagram. In the first turn, the released carbons are not the newly entering acetyl carbons.
Can I make an editable Krebs cycle diagram?
Yes. Use Editable Diagram for separate intermediates and arrows. Review carbon counts, arrow direction and per-turn yield. Generation needs an account and credits.
Sources and editorial notes
- OpenStax Biology 2e: Oxidation of Pyruvate and the Citric Acid Cycle
- OpenStax Biology 2e: Oxidative Phosphorylation
Prepared by the AcaDraw product team. Source and diagram check: . This is an introductory educational model; independent expert review has not been completed. Generated drafts need checking against reliable references.
Create a krebs cycle diagram for your lesson
Choose the scope, generate a draft, then review labels and connections before sharing.
Krebs Cycle Diagram: Intermediates, Carbon Counts, and Yield