Cellular Respiration Diagram Generator
Follow this cellular respiration diagram from glucose to ATP. Place each stage in the correct compartment, connect pyruvate to acetyl-CoA, and distinguish carbon flow from electron carriers before generating your own teaching draft.
SEE ACADRAW IN ACTION
Science drawing, from idea to editable figure
Create a science illustration with AI. Refine drawings, build editable diagrams, and convert images to SVG.
Demos play as you scroll into view. Choose a feature to explore.
Trusted by students & researchers from 480+ universities
A global community spanning 60+ countries and regions, from QS top-ranked universities to leading research institutes






















University logos belong to their respective institutions and are shown solely to illustrate our user community. They do not imply any partnership or endorsement.
Tool overview
Explore the use cases, workflow, and key things to know.
Locate each stage
Keep cytosol, matrix and inner mitochondrial membrane distinct.
Follow carbon and electrons
Add the link reaction and connect NADH/FADH₂ to oxidative phosphorylation.
Use ATP yields with context
Label estimates per glucose and avoid presenting one number as universal.
Labeled teaching reference
Labeled cellular respiration diagram: stages and compartments
This cellular respiration diagram models aerobic glucose breakdown in a eukaryotic cell. Glycolysis occurs in the cytosol; pyruvate oxidation and most Krebs-cycle reactions occur in the mitochondrial matrix. Oxidative phosphorylation couples the inner-membrane electron transport chain to ATP synthase. The diagram groups reactions and is not a measured flux chart.
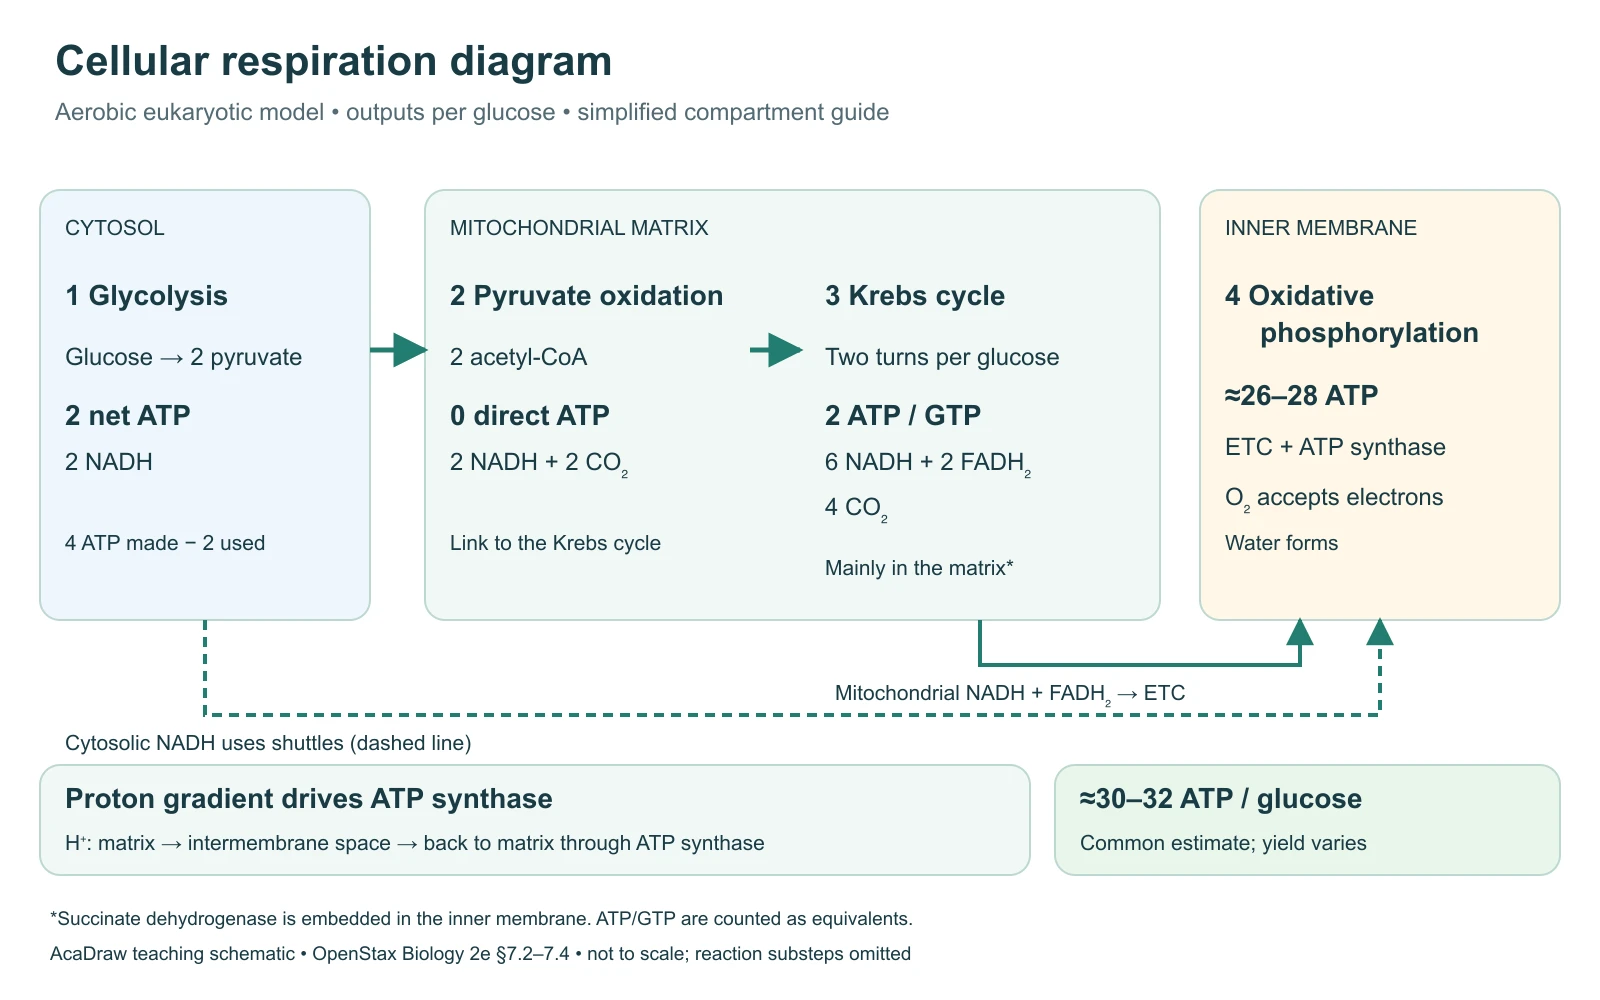
Cellular respiration diagram stages, sites and ATP yield
Use the labels with the reference, then choose the detail level your lesson needs. On a small screen, scroll the table horizontally.
| Stage or component | Site in a eukaryotic cell | Products per glucose and drawing note |
|---|---|---|
| Glycolysis | Cytosol | Glucose becomes 2 pyruvate. Produces 2 net ATP and 2 NADH; 4 ATP are formed but 2 were invested. |
| Pyruvate oxidation / link reaction | Mitochondrial matrix | 2 pyruvate become 2 acetyl-CoA, releasing 2 CO₂ and producing 2 NADH. No ATP is made directly. |
| Krebs / citric acid cycle | Mainly mitochondrial matrix | Two turns yield 4 CO₂, 6 NADH, 2 FADH₂ and 2 ATP equivalents (ATP or GTP). Succinate dehydrogenase is inner-membrane-bound. |
| Electron transport chain | Inner mitochondrial membrane | Receives electrons from reduced carriers and transfers them ultimately to oxygen. Coupled proton pumping builds an electrochemical gradient. |
| ATP synthase / chemiosmosis | Inner mitochondrial membrane | Protons return toward the matrix through ATP synthase. Oxidative phosphorylation contributes about 26–28 ATP in the conventional estimate. |
| Oxygen and water | At the end of the electron transport chain | Oxygen is the final electron acceptor and is reduced to water. Oxygen does not enter glycolysis as a direct reactant. |
| Overall ATP estimate | Aerobic glucose breakdown | About 30–32 ATP per glucose in a common eukaryotic model: 2 glycolytic + 2 cycle ATP equivalents + about 26–28 oxidative ATP. Actual yield varies. |
Read matter and energy in a cellular respiration diagram
A cellular respiration diagram combines several linked processes. Use separate line styles for carbon substrates, reduced electron carriers and proton movement so the connections remain understandable.
Carbon follows a four-stage route
Glucose → two pyruvate → two acetyl-CoA → oxidation through two cycle turns. Carbon dioxide is released during the link reaction and cycle, not during glycolysis.
Carriers connect the stages
NADH and FADH₂ carry reducing equivalents toward the respiratory chain. Cytosolic NADH itself does not simply cross the inner mitochondrial membrane; shuttle systems transfer its reducing equivalents.
ATP formation has two mechanisms
Glycolysis and the cycle make a small ATP-equivalent yield by substrate-level phosphorylation. Most ATP comes from oxidative phosphorylation powered by the proton gradient.
Common cellular respiration diagram mistakes
Putting glycolysis inside the mitochondrion
Place glycolysis in the cytosol. Move pyruvate-derived carbon into the mitochondrial pathway through a named link reaction.
Showing 36 or 38 ATP as a universal total
Specify the organism, assumptions and textbook model. For this eukaryotic overview use approximately 30–32 ATP and explain the source of variation.
Treating respiration as breathing
Ventilation moves air; cellular respiration is intracellular metabolism. Plants also carry out cellular respiration, including in the light.
Create your own cellular respiration diagram
Reading the reference is free. Generating a new draft requires an account and available credits. See current pricing.
Choose Science Drawing for an illustrated draft, or Editable Diagram for separate shapes and text labels. Review the science and all connections before using either result.
- 1
Choose the biological context
Use a eukaryotic aerobic model or explicitly request a prokaryotic model with different locations.
- 2
Map stages and compartments
Include the link reaction, carbon products and the carrier connections, with a clear arrow legend.
- 3
Check ATP and arrow meaning
Keep net and gross ATP separate. Review compartments, oxygen use and the assumptions behind each yield.
A prompt you can adapt
Create an educational cellular respiration diagram for aerobic glucose breakdown in a eukaryotic cell. Place glycolysis in the cytosol, pyruvate oxidation and most Krebs-cycle reactions in the mitochondrial matrix, and electron transport plus ATP synthase at the inner mitochondrial membrane. Show glucose to 2 pyruvate to 2 acetyl-CoA and two cycle turns. Use solid arrows for carbon flow and dashed arrows for NADH/FADH2 reducing equivalents; note the cytosolic shuttle. Label CO2 release at the link reaction and cycle, O2 as final electron acceptor, and proton return through ATP synthase toward the matrix. Give approximate ATP per glucose: 2 net from glycolysis, 2 cycle equivalents and 26–28 from oxidative phosphorylation, about 30–32 total with stated variability.
Use this prompt in the generatorCellular Respiration diagram FAQ
What are the stages in a cellular respiration diagram?
The overview includes glycolysis, pyruvate oxidation, the Krebs or citric acid cycle, and oxidative phosphorylation. Many three-stage summaries group pyruvate oxidation with the cycle.
Where does cellular respiration happen?
In this eukaryotic model, glycolysis is cytosolic, pyruvate oxidation and most cycle reactions are in the matrix, and oxidative phosphorylation uses the inner mitochondrial membrane. Prokaryotes do not have mitochondria.
How much ATP is produced per glucose?
A common eukaryotic teaching estimate is about 30–32 ATP: 2 net glycolytic ATP, 2 cycle ATP equivalents and about 26–28 from oxidative phosphorylation. Yield depends on shuttles and coupling; it is not a universal measured total.
Where is oxygen used?
Oxygen accepts electrons at the end of the electron transport chain and is reduced to water. Glycolysis does not directly consume oxygen, although continued aerobic metabolism depends on downstream carrier recycling.
Is cellular respiration the same as breathing?
No. Breathing moves air into and out of the lungs. Cellular respiration is a set of metabolic processes in cells; gas exchange and circulation connect oxygen supply to those processes.
Do plants carry out cellular respiration?
Yes. Plant cells carry out respiration as well as photosynthesis. Respiration is not restricted to nighttime.
Can I make an editable cellular respiration diagram?
Choose Editable Diagram for separate shapes and labels or Science Drawing for an illustrated draft. Generation needs an account and credits; check the science before exporting.
Sources and editorial notes
- OpenStax Biology 2e: Glycolysis
- OpenStax Biology 2e: Oxidation of Pyruvate and the Citric Acid Cycle
- OpenStax Biology 2e: Oxidative Phosphorylation
Prepared by the AcaDraw product team. Source and diagram check: . This is an introductory educational model; independent expert review has not been completed. Generated drafts need checking against reliable references.
Create a cellular respiration diagram for your lesson
Choose the scope, generate a draft, then review labels and connections before sharing.
Cellular Respiration Diagram: Stages, Locations, and Energy FlowPhotosynthesis diagram
Compare carbon fixation with the oxidation of glucose; plants use both processes.
Respiratory system diagram
Separate intracellular metabolism from air movement and gas exchange.
Bacterial cell diagram
Understand why a prokaryotic respiration model cannot use mitochondrial compartments.