KWL Chart Maker
A KWL chart gives learners a visible before-and-after structure: what they know, what they want to know and what they learned. Use this maker to draft prompts and leave room for evidence-based reflections.
SEE ACADRAW IN ACTION
Science drawing, from idea to editable figure
Create a science illustration with AI. Refine drawings, build editable diagrams, and convert images to SVG.
Demos play as you scroll into view. Choose a feature to explore.
Trusted by students & researchers from 480+ universities
A global community spanning 60+ countries and regions, from QS top-ranked universities to leading research institutes
























University logos belong to their respective institutions and are shown solely to illustrate our user community. They do not imply any partnership or endorsement.
Tool overview
Explore the use cases, workflow, and key things to know.
Choose the topic
Set a bounded lesson question and create the three columns.
Collect questions
Invite prior ideas and open questions before providing the reference material.
Revisit with evidence
Complete Learned entries, cite sources and note what remains uncertain.
Concept reference
KWL chart: a worked reference
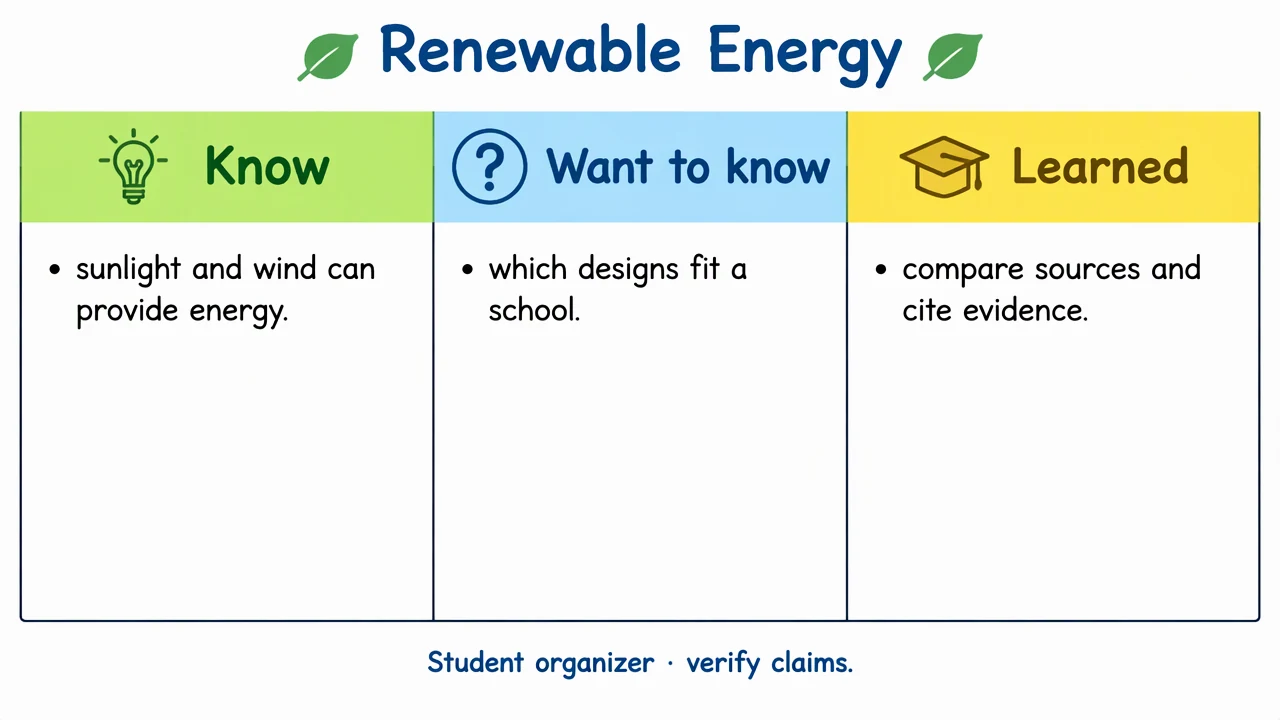
The renewable-energy organizer shows a tentative prior idea in Know, a school-focused inquiry question in Want to know, and prompts to compare sources and cite evidence in Learned. The final column is a prompt to complete after the lesson, not a claim that learning has already been verified.
KWL chart column key
Use the reference and definitions together. On a small screen, scroll the table horizontally.
| Element | Meaning | Review check |
|---|---|---|
| Know | Prior ideas or experience | Mark uncertain claims so they can be checked. |
| Want to know | Questions that guide inquiry | Write questions that can be answered with evidence. |
| Learned | Takeaways after investigation | Add a source or example, not just a repeated opinion. |
| Prompt | Teacher or learner question | Keep the prompt open enough to invite reasoning. |
| Reflection | What changed or remains open | Record uncertainty and next questions. |
Plan your KWL chart
Use KWL columns to support inquiry and reflection. Entries are learner notes, not a statistical measure of learning or a substitute for assessment.
Surface prior knowledge
The Know column helps a teacher see starting points and misconceptions without grading the entry.
Turn curiosity into questions
The Want to know column works best when questions are specific enough to investigate.
Close the loop
The Learned column should connect to evidence and leave room for questions that remain unresolved.
Common mistakes to avoid
Treating Know as fact
Prior knowledge can be incomplete or wrong. Mark claims for checking.
Writing teacher answers in Want
Questions should belong to the learner’s inquiry, not become a hidden answer key.
Filling Learned with slogans
Ask for evidence, examples or source notes where appropriate.
KWL Chart Maker: from brief to checked draft
Reading the reference is free. Generating a new draft requires an account and available credits. See current pricing.
Choose Science Drawing for an illustrated draft, or Editable Diagram for separate shapes and labels. Review all definitions, labels and connections before sharing.
- 1
Choose the topic
Set a bounded lesson question and create the three columns.
- 2
Collect questions
Invite prior ideas and open questions before providing the reference material.
- 3
Revisit with evidence
Complete Learned entries, cite sources and note what remains uncertain.
A prompt you can adapt
Create an original classroom KWL chart on a clean white landscape canvas titled Renewable Energy. Three equal columns labeled Know, Want to know, Learned. Add concise example entries: Know—sunlight and wind can provide energy; Want to know—which designs fit a school; Learned—compare sources and cite evidence. Add footer Student organizer · verify claims. No charts or percentages, readable exact English labels.
Use this prompt in the generatorKWL Chart FAQ
What does KWL stand for?
Know, Want to know and Learned. The chart organizes prior knowledge, questions and takeaways.
Is a KWL chart an assessment score?
No. It is a learning organizer. Use a separate assessment when you need evidence of achievement.
Can a KWL chart be digital?
Yes. An editable chart can be revisited during a lesson or research task.
How do I avoid misconceptions?
Treat prior entries as hypotheses to check, and ask learners to support Learned entries with evidence.
Sources and editorial notes
Prepared by the AcaDraw product team. Source and diagram check: . This is a simplified educational model; independent expert review has not been completed. AI-generated drafts need checking against reliable references.
Explore the KWL chart guide
Use KWL columns to support inquiry and reflection. Entries are learner notes, not a statistical measure of learning or a substitute for assessment.
KWL Chart: Turn Prior Knowledge into Better Questions