Spider Diagram Maker
A spider diagram starts with one topic and spreads related ideas outward. Use this spider diagram maker to draft a radial brainstorm, group related points and leave space for additions before turning the sketch into a presentation or worksheet.
SEE ACADRAW IN ACTION
Science drawing, from idea to editable figure
Create a science illustration with AI. Refine drawings, build editable diagrams, and convert images to SVG.
Demos play as you scroll into view. Choose a feature to explore.
Trusted by students & researchers from 480+ universities
A global community spanning 60+ countries and regions, from QS top-ranked universities to leading research institutes
























University logos belong to their respective institutions and are shown solely to illustrate our user community. They do not imply any partnership or endorsement.
Tool overview
Explore the use cases, workflow, and key things to know.
Brainstorm before ranking
A spider diagram helps collect possibilities without committing to a causal order. Put judgments and priority scores in a separate decision step.
Keep categories parallel
Mixing technologies, outcomes and problems at the same level creates overlap. Choose one way to group ideas before adding details.
Choose another map when needed
A concept map labels relationships; a flowchart orders steps. Use those structures when relationships or sequence are the main message.
Concept reference
Spider Diagram: a worked example
The renewable-energy example places Solar, Wind, Hydro and Geothermal around a shared center. The spokes express topic membership, not energy flow, hierarchy or equal contribution. Supporting notes stay next to their parent branch.
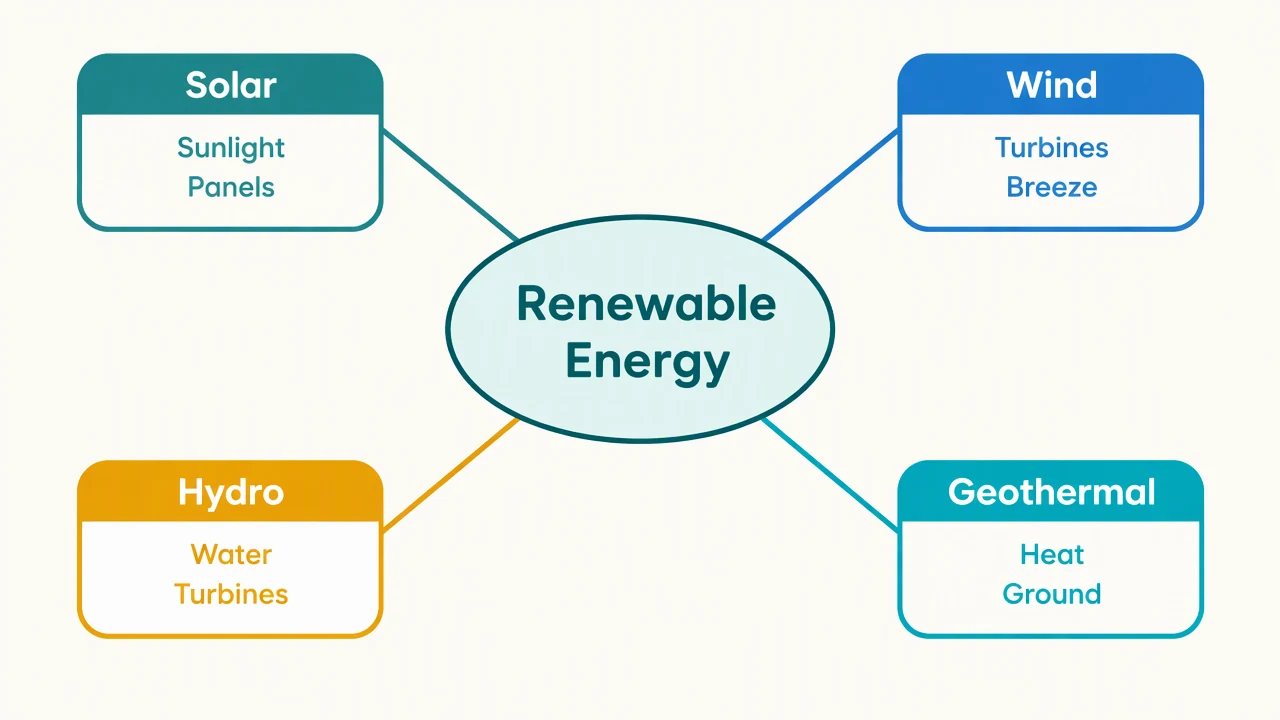
Spider Diagram reference key
Use the reference and definitions together. On a small screen, scroll the table horizontally.
| Element | Meaning | Review check |
|---|---|---|
| Center | One bounded topic | Use a short noun phrase such as Renewable Energy rather than a paragraph. |
| Main branch | A broad category related to the topic | Give each category enough room for notes and future additions. |
| Sub-idea | A detail under one branch | Keep the same level of detail across sibling ideas where possible. |
| Spoke | Membership in the central topic | Do not add arrowheads unless direction has a defined meaning. |
| Cross-link | A relationship between branches | If many cross-links are essential, a concept map may communicate better. |
Plan your spider diagram
Use radial grouping when you need to explore a topic before deciding which relationships deserve a more structured map.
Brainstorm before ranking
A spider diagram helps collect possibilities without committing to a causal order. Put judgments and priority scores in a separate decision step.
Keep categories parallel
Mixing technologies, outcomes and problems at the same level creates overlap. Choose one way to group ideas before adding details.
Choose another map when needed
A concept map labels relationships; a flowchart orders steps. Use those structures when relationships or sequence are the main message.
Common mistakes to avoid
A center that is too broad
Split Science into a specific topic such as Renewable Energy to make branches useful.
Decorative arrows
A radial line does not establish direction, influence or a measured relationship.
Crowded branch ends
Shorten labels and move notes outward instead of shrinking text until it is unreadable.
Spider Diagram Maker: from brief to checked draft
Reading the reference is free. Generating a new draft requires an account and available credits. See current pricing.
Choose Science Drawing for an illustrated draft, or Editable Diagram for separate shapes and labels. Review all definitions, labels and connections before sharing.
- 1
Bound the topic
Choose one question or topic and list possible categories.
- 2
Group the ideas
Generate a radial draft with short labels and supporting notes.
- 3
Review the structure
Move overlapping branches and check that the grouping communicates your intent.
A prompt you can adapt
Create an editable spider diagram centered on Renewable Energy with four radial branches: Solar, Wind, Hydro and Geothermal. Add two concise supporting ideas per branch. Use spokes without arrowheads, clear spacing and readable labels; do not imply energy flow or measured shares.
Use this prompt in the generatorSpider Diagram FAQ
What is a spider diagram?
It is a radial organizer with one central topic and branches containing related categories or ideas.
How is it different from a concept map?
Spider diagrams mainly group ideas around a center. Concept maps usually label relationships between multiple concepts and may include cross-links.
Can I add more branches?
Yes. In Editable Diagram, move the shapes and labels to keep the center readable as you add ideas.
Does branch length represent importance?
Not by default. Add an explicit legend if length, color or line weight has a meaning.
Sources and editorial notes
Prepared by the AcaDraw product team. Source and diagram check: . This is a simplified educational model; independent expert review has not been completed. AI-generated drafts need checking against reliable references.
Explore the spider diagram guide
Use radial grouping when you need to explore a topic before deciding which relationships deserve a more structured map.
Spider Diagram: A Central Topic, Clear Branches, Better Ideas