Fault Tree Diagram Maker
Use the fault tree diagram maker to break an unwanted top event into contributing failures. Label AND and OR gates, define basic events and review the logic without inventing failure probabilities.
SEE ACADRAW IN ACTION
Science drawing, from idea to editable figure
Create a science illustration with AI. Refine drawings, build editable diagrams, and convert images to SVG.
Demos play as you scroll into view. Choose a feature to explore.
Trusted by students & researchers from 480+ universities
A global community spanning 60+ countries and regions, from QS top-ranked universities to leading research institutes
























University logos belong to their respective institutions and are shown solely to illustrate our user community. They do not imply any partnership or endorsement.
Tool overview
Explore the use cases, workflow, and key things to know.
Set the unwanted condition
Write the top event, operating state, boundary and assumptions.
Decompose with gates
Use the fault tree diagram maker to label intermediate events and AND/OR logic.
Review every combination
Check sufficiency, dependencies, repeated events and missing causes.
Concept reference
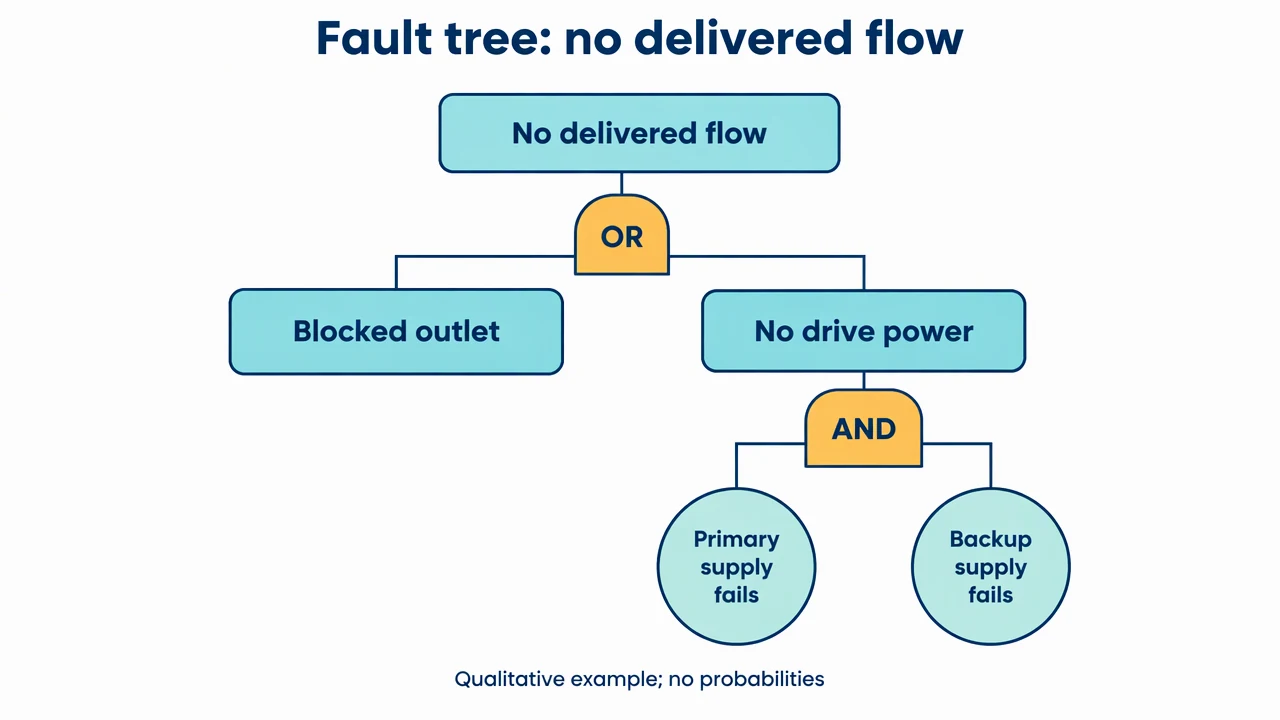
Fault tree: a pump fails to deliver flow
A qualitative example uses an OR gate for alternative causes and an AND gate for a primary and backup supply failing together. It does not estimate failure likelihood.
Fault Tree Diagram Maker: reference key
Use the reference and definitions together. On a small screen, scroll the table horizontally.
| Element | Meaning | Review check |
|---|---|---|
| Top event | The unwanted condition being analyzed | Define operating state and system boundary. |
| Intermediate event | A failure explained by lower-level events | Make the causal decomposition explicit. |
| Basic event | A leaf not further decomposed in this model | Give it a testable, specific definition. |
| OR gate | Any input event is sufficient for the output | Confirm each child can cause the parent under the assumptions. |
| AND gate | All input events are required for the output | Account for shared causes and dependencies separately. |
| Assumption | A condition limiting the analysis | Record standby state, coverage and excluded mechanisms. |
Fault Tree Diagram Maker: plan the visual
Use the fault tree diagram maker to break an unwanted top event into contributing failures. Label AND and OR gates, define basic events and review the logic without inventing failure probabilities.
Define the top event narrowly
Pump failure is too broad if the analysis concerns no delivered flow during a demanded operation. Use the fault tree diagram maker with a defined operating state and boundary. A precise top event keeps maintenance issues, start-up behavior and running failures from being mixed together.
Read gates as Boolean statements
At an OR gate, any child event is sufficient under the stated assumptions. At an AND gate, all listed child events are required. Read each branch in a sentence before accepting the picture, especially when backup components or shared resources are involved.
Keep qualitative and quantitative analysis separate
A fault tree can explain combinations of failure without assigning likelihood. Probabilities need justified event rates, mission time, dependency treatment and an appropriate model. This page provides a visual draft, not a reliability calculation or safety certification.
Common mistakes to avoid
Using AND to mean then
An AND gate is logical conjunction, not a sequence. If event order matters, describe that limitation or use an appropriate temporal model.
Ignoring common-cause failures
Two supplies may share a power source or environment. Separate leaf icons do not prove independence.
Adding invented probabilities
A plausible percentage changes the claim from qualitative explanation to quantitative analysis. Keep rates out unless they come from a reviewed analysis.
Fault Tree Diagram Maker: from brief to draft
Reading the reference is free. Generating a new draft requires an account and available credits. See current pricing.
Choose Science Drawing for an illustrated draft, or Editable Diagram for separate shapes and labels. Review all definitions, labels and connections before sharing.
- 1
Set the unwanted condition
Write the top event, operating state, boundary and assumptions.
- 2
Decompose with gates
Use the fault tree diagram maker to label intermediate events and AND/OR logic.
- 3
Review every combination
Check sufficiency, dependencies, repeated events and missing causes.
Example brief for the fault tree diagram maker
Original educational scientific illustration on white, 1280x720 landscape. Crisp vector-like editorial artwork, navy text, teal and amber accents, generous whitespace, large legible English labels. All structures, labels and connecting arrows rendered by the image model. No third-party artwork, logo, photograph, experimental measurement or numerical performance claim. Title 'Fault tree: no delivered flow'. Top rectangle 'No delivered flow'. Below a gate clearly labeled 'OR', branches to rectangle 'Blocked outlet' and rectangle 'No drive power'. Below 'No drive power', a clearly labeled 'AND' gate connects two leaf circles labeled 'Primary supply fails' and 'Backup supply fails'. Make the hierarchy top down and connector lines clean. Do not use arrowheads or unexplained standard gate shapes; plain rounded boxes with AND/OR text are fine. Footer 'Qualitative example; no probabilities'.
Use this prompt in the generatorFault Tree Diagram Maker: common questions
What does the fault tree diagram maker create?
It drafts a qualitative hierarchy of an unwanted top event and contributing failures connected by explicit logic gates.
Does it compute failure probability?
No. It does not calculate reliability, minimal cut sets or safety integrity levels.
Is this a fishbone diagram?
No. A fault tree uses explicit logical combinations; a fishbone organizes candidate causes into categories.
Can it be used for a safety decision?
Use it only as a drafting aid. A safety decision requires the applicable analysis process, evidence and qualified review.
Sources and editorial notes
Prepared by the AcaDraw product team. Source and diagram check: . This is a simplified educational model; independent expert review has not been completed. AI-generated drafts need checking against reliable references.
Explore the fault tree diagram guide
A qualitative example uses an OR gate for alternative causes and an AND gate for a primary and backup supply failing together. It does not estimate failure likelihood.
Fault Tree Diagrams: Top Events and AND/OR Logic