Fishbone Diagram Maker
Use the fishbone diagram maker to organize candidate causes around a clearly defined problem. Adapt the branches to your work, then separate brainstorming ideas from causes supported by evidence.
SEE ACADRAW IN ACTION
Science drawing, from idea to editable figure
Create a science illustration with AI. Refine drawings, build editable diagrams, and convert images to SVG.
Demos play as you scroll into view. Choose a feature to explore.
Trusted by students & researchers from 480+ universities
A global community spanning 60+ countries and regions, from QS top-ranked universities to leading research institutes
























University logos belong to their respective institutions and are shown solely to illustrate our user community. They do not imply any partnership or endorsement.
Tool overview
Explore the use cases, workflow, and key things to know.
Define the effect
Write an observable problem with the relevant scope and timeframe.
Group candidate causes
Use the fishbone diagram maker with categories and short, testable subcauses.
Plan the investigation
Check evidence, prioritize uncertainties and assign the next observation or test.
Concept reference
Fishbone diagram: investigate a late report
An Ishikawa-style layout groups candidate causes of a late report under people, process, tools and inputs. The branches are an investigation checklist, not a confirmed causal model.
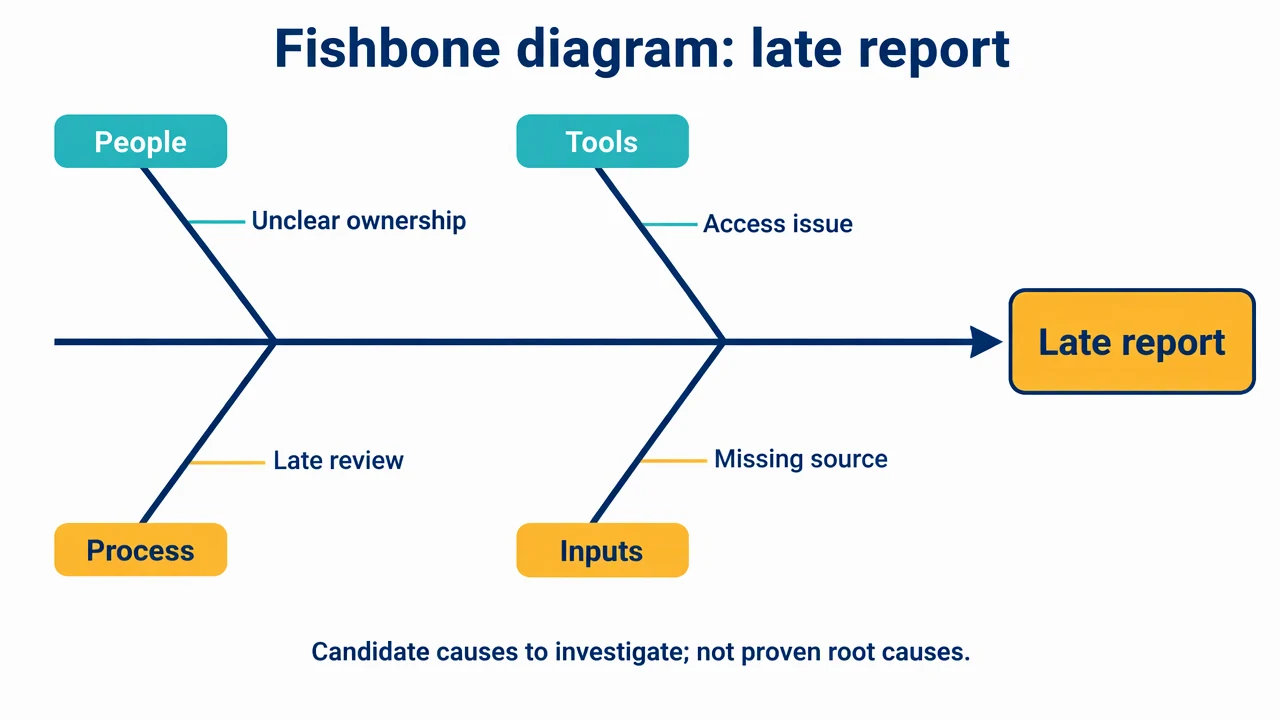
Fishbone Diagram Maker: reference key
Use the reference and definitions together. On a small screen, scroll the table horizontally.
| Element | Meaning | Review check |
|---|---|---|
| Effect | The problem written at the head | Use an observable statement and a defined context. |
| Spine | The main line leading to the effect | Keep one problem per diagram. |
| Main branch | A category grouping candidate causes | Choose categories that fit the work rather than forcing a template. |
| Subcause | A more specific contributing possibility | Write a condition that can be checked. |
| Evidence | An observation supporting or rejecting a cause | Keep it separate from brainstorming labels. |
| Action | A planned response after investigation | Assign ownership only after the cause and intervention are considered. |
Fishbone Diagram Maker: plan the visual
Use the fishbone diagram maker to organize candidate causes around a clearly defined problem. Adapt the branches to your work, then separate brainstorming ideas from causes supported by evidence.
Write a problem without embedding its cause
Late report is a better starting effect than staff caused a late report. The fishbone diagram maker should begin with an observable outcome, scope and timeframe so the team can explore explanations without a predetermined culprit.
Choose useful categories
The manufacturing 6M categories are a starting convention, not a requirement. For a research workflow, people, process, tools and inputs may be clearer. Use categories that help people remember overlooked conditions and avoid duplicating the same cause across every branch.
Turn branches into investigation questions
A candidate such as unclear ownership becomes useful when someone asks who owned the task, where that was recorded and what happened at handover. Attach evidence and next checks in the discussion record; the image alone does not establish the root cause.
Common mistakes to avoid
Confusing a list with proof
The number of branches does not measure causal strength. Validate proposed causes with observations or an appropriate test.
Making every branch about people
Process constraints, missing inputs and tool access may explain the same outcome. Describe conditions instead of assigning blame.
Adding solutions before causes are checked
Training or a new tool may not address the actual mechanism. Keep the candidate cause, evidence and action distinct.
Fishbone Diagram Maker: from brief to draft
Reading the reference is free. Generating a new draft requires an account and available credits. See current pricing.
Choose Science Drawing for an illustrated draft, or Editable Diagram for separate shapes and labels. Review all definitions, labels and connections before sharing.
- 1
Define the effect
Write an observable problem with the relevant scope and timeframe.
- 2
Group candidate causes
Use the fishbone diagram maker with categories and short, testable subcauses.
- 3
Plan the investigation
Check evidence, prioritize uncertainties and assign the next observation or test.
Example brief for the fishbone diagram maker
Original educational scientific illustration on white, 1280x720 landscape. Crisp vector-like editorial artwork, navy text, teal and amber accents, generous whitespace, large legible English labels. All structures, labels and connecting arrows rendered by the image model. No third-party artwork, logo, photograph, experimental measurement or numerical performance claim. Title 'Fishbone diagram: late report'. Single horizontal spine pointing right to a box labeled 'Late report'. Four diagonal main branches with short cause labels: upper-left 'People' with 'Unclear ownership'; lower-left 'Process' with 'Late review'; upper-middle 'Tools' with 'Access issue'; lower-middle 'Inputs' with 'Missing source'. Keep labels separate from bones, no overlapping text. Clear fishbone structure, no fish illustration. Footer 'Candidate causes to investigate; not proven root causes'.
Use this prompt in the generatorFishbone Diagram Maker: common questions
What does the fishbone diagram maker create?
It creates an Ishikawa-style cause-and-effect draft with a problem head, category branches and candidate subcauses.
Must I use the 6M categories?
No. Choose categories that fit the context; 6M is one useful manufacturing convention.
Does the diagram identify the true root cause?
No. It organizes hypotheses. Evidence and investigation determine which causes are supported.
How is it different from a fault tree?
A fishbone groups possible causes; a fault tree models explicit AND/OR combinations leading to an unwanted event.
Sources and editorial notes
Prepared by the AcaDraw product team. Source and diagram check: . This is a simplified educational model; independent expert review has not been completed. AI-generated drafts need checking against reliable references.
Explore the fishbone diagram guide
An Ishikawa-style layout groups candidate causes of a late report under people, process, tools and inputs. The branches are an investigation checklist, not a confirmed causal model.
Fishbone Diagrams: Cause Categories and Evidence