DNA Diagram Generator
Create a DNA diagram that separates the sugar-phosphate backbones from paired bases. Show strand direction and a small base-pair detail without treating the schematic as a molecular scale model.
SEE ACADRAW IN ACTION
Science drawing, from idea to editable figure
Create a science illustration with AI. Refine drawings, build editable diagrams, and convert images to SVG.
Demos play as you scroll into view. Choose a feature to explore.
Trusted by students & researchers from 480+ universities
A global community spanning 60+ countries and regions, from QS top-ranked universities to leading research institutes























University logos belong to their respective institutions and are shown solely to illustrate our user community. They do not imply any partnership or endorsement.
Tool overview
Explore the use cases, workflow, and key things to know.
Separate the structural levels
Keep the backbone, nucleotide bases and hydrogen-bond pairing as distinct visual ideas.
Show direction clearly
Use 5′ and 3′ only when the strand direction is explicitly requested and checked.
Use a focused teaching draft
Adapt the labeled DNA diagram into a blank worksheet or a base-pair close-up.
Labeled teaching reference
DNA diagram: double helix, base pairs and strand direction
This DNA diagram is a simplified teaching schematic. It shows two antiparallel sugar-phosphate backbones, paired bases and hydrogen-bond markers; bond lengths, angles and molecular dimensions are not to scale.
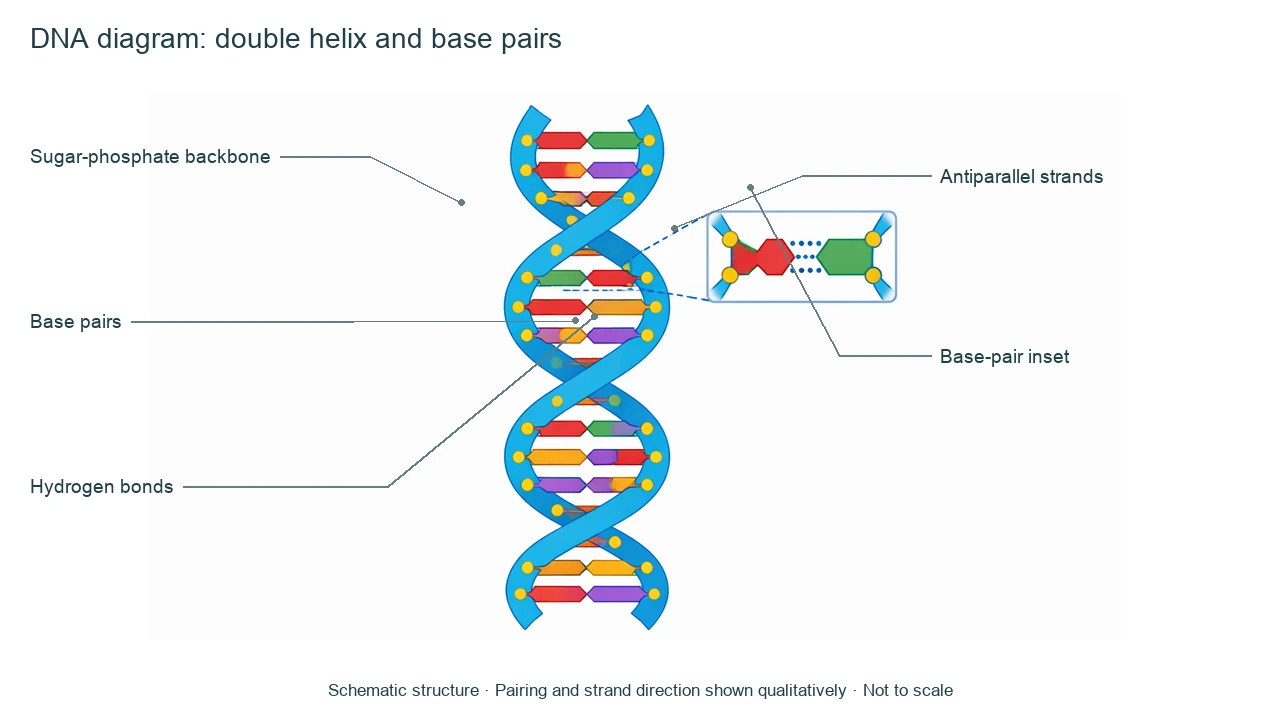
DNA label key
Use the labels with the reference, then choose the detail level your lesson needs. On a small screen, scroll the table horizontally.
| Label or stage | Position or relationship | Meaning and drawing check |
|---|---|---|
| Sugar-phosphate backbone | Two outer strands | A continuous backbone supports the bases; it is not a single solid ribbon. |
| Base pairs | Rungs between the strands | A pairs with T and G pairs with C in the standard DNA model. |
| Hydrogen bonds | Between paired bases | Hydrogen bonds help stabilize the paired bases; they are not the backbone. |
| Antiparallel strands | Opposite strand directions | The two strands run in opposite orientations; add 5′ and 3′ only when needed. |
| Nucleotide | Backbone plus base plus sugar | A nucleotide is a repeating unit; do not label every colored bead as a separate molecule. |
| Double helix | Overall geometry | The helix is a visual model and should not be read as a measured atomic structure. |
Read the DNA diagram from backbone to base pair
A useful DNA diagram moves from the two backbones to the paired bases, then adds direction and a close-up only when they help the lesson.
Backbones frame the molecule
The sugar-phosphate strands form the outside edges while bases point inward.
Pairing carries information
Complementary pairing gives the diagram its repeating rung pattern; it does not show gene expression by itself.
Scale needs a separate model
A classroom illustration can show topology and pairing without claiming atomic distances.
Common dna mistakes
Treating the helix as a ladder
The backbone should curve around the paired bases rather than becoming two parallel rails.
Mixing DNA and RNA labels
RNA differs in sugar, bases and common structure; state the molecule before drawing.
Reading colors as a code
Colors are visual aids unless a legend defines their meaning.
Create your own dna diagram
Reading the reference is free. Generating a new draft requires an account and available credits. See current pricing.
Choose Science Drawing for an illustrated draft, or Editable Diagram for separate shapes and text labels. Review the science and all connections before using either result.
- 1
Set the molecule
Choose DNA, the view and the structural labels before adding a process.
- 2
Generate a clear draft
Keep the helix centered and use a close-up only for base pairing or bonds.
- 3
Review the labels
Check pairing, direction and any legend against a reliable biology source.
A prompt you can adapt
Create a labeled DNA diagram with a clean double helix. Show two antiparallel sugar-phosphate backbones, paired A–T and G–C bases, short hydrogen-bond markers and a small base-pair inset. Keep labels editable, use a white background and state that geometry and dimensions are schematic. Do not invent sequence data or molecular measurements.
Use this prompt in the generatorDNA diagram FAQ
What does a DNA diagram show?
A basic DNA diagram shows two sugar-phosphate strands and complementary base pairs arranged as a double helix.
Which bases pair in DNA?
Adenine pairs with thymine, and guanine pairs with cytosine in the standard model.
Are the two DNA strands parallel?
They are antiparallel: the strands run in opposite directions.
Is this DNA diagram to scale?
No. It is a simplified educational model of structure and pairing.
Can I edit a DNA diagram?
Yes. Editable Diagram keeps shapes and labels separate; Science Drawing creates an illustrated draft. Review the result before sharing.
Sources and editorial notes
Prepared by the AcaDraw product team. Source and diagram check: . This is an introductory educational model; independent expert review has not been completed. Generated drafts need checking against reliable references.
Create a dna diagram for your lesson
Choose the scope, generate a draft, then review labels and connections before sharing.
DNA Diagram: Double Helix, Base Pairs, and Strand Direction