Cell Cycle Diagram Generator
Build a cell cycle diagram that separates growth, DNA replication and division. Explore G1, S, G2 and M, place G0 outside the active cycle, then create a labeled draft for your class or study notes.
SEE ACADRAW IN ACTION
Science drawing, from idea to editable figure
Create a science illustration with AI. Refine drawings, build editable diagrams, and convert images to SVG.
Demos play as you scroll into view. Choose a feature to explore.
Trusted by students & researchers from 480+ universities
A global community spanning 60+ countries and regions, from QS top-ranked universities to leading research institutes























University logos belong to their respective institutions and are shown solely to illustrate our user community. They do not imply any partnership or endorsement.
Tool overview
Explore the use cases, workflow, and key things to know.
Map the whole cycle
Read interphase and M as different parts of the same sequence, rather than treating the cell cycle as mitosis alone.
Check when DNA doubles
DNA replication happens during S. Chromosome number is conventionally counted by centromeres, so it does not simply double with DNA content.
Create a focused teaching draft
Specify phase labels, a G0 branch or a checkpoint view before choosing an illustrated or editable layout.
Labeled teaching reference
Cell cycle diagram: follow G1, S, G2 and M
This cell cycle diagram follows a conventional animal-cell model. Interphase includes G1, S and G2; M includes mitosis and cytokinesis. The two small cells mark completion of division. The DNA motifs in S are symbolic, not a chromosome count. Arrow spacing does not represent how long each phase lasts.
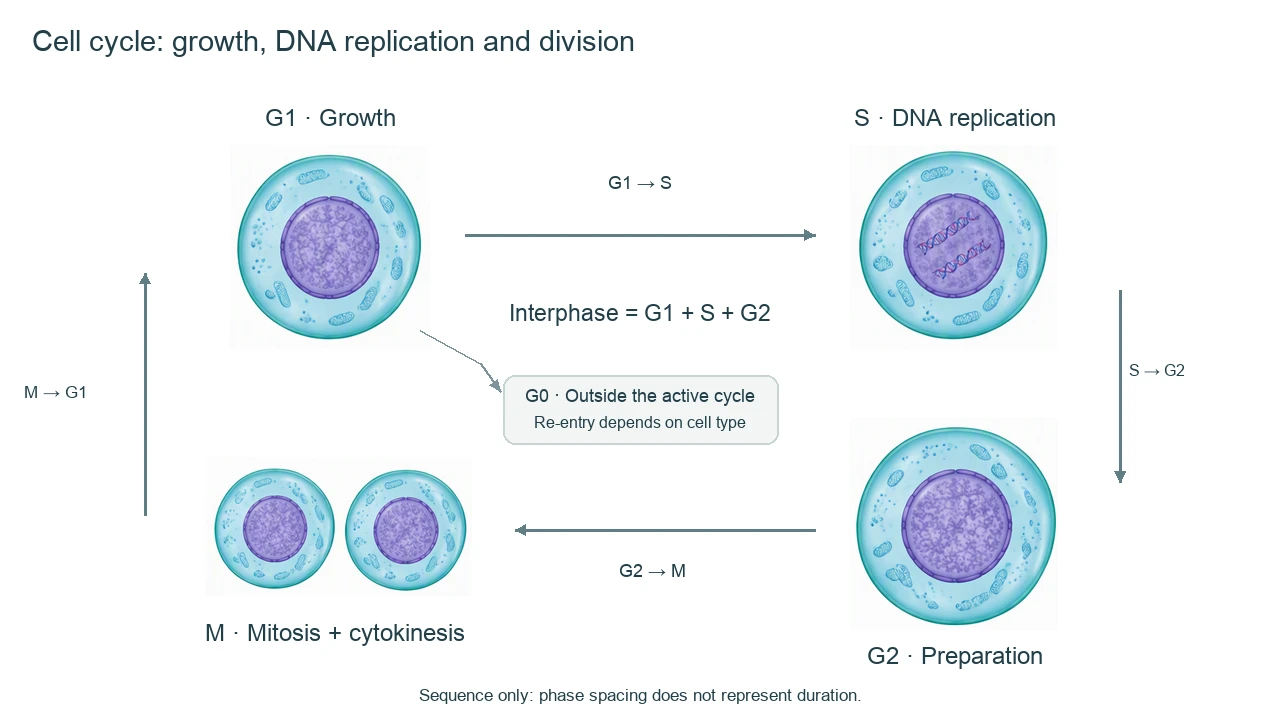
Cell cycle diagram phases and checkpoint key
Use the labels with the reference, then choose the detail level your lesson needs. On a small screen, scroll the table horizontally.
| Phase or checkpoint | Main event | What to label or check |
|---|---|---|
| G1 phase | Growth and biosynthesis | Before S, a typical diploid cell has 2n chromosomes and 2C DNA. G1 is active growth, not an inactive gap. |
| S phase | DNA replication | DNA content rises from 2C to 4C in this model. Replicated chromosomes have sister chromatids; chromosome number remains 2n before their separation. |
| G2 phase | Preparation for division | A typical diploid cell remains 2n with 4C DNA. Preparation and checks precede entry into mitosis. |
| M phase | Mitosis and cytokinesis | Nuclear division and cytoplasmic division produce daughter cells. Cytokinesis commonly overlaps late mitosis. |
| G0 | Outside the active cycle | A cell may exit the active cycle, often from G1. Some cells re-enter; many differentiated cells remain outside the cycle. |
| G1, G2 and spindle checkpoints | Control of progression | Check favorable conditions and DNA integrity before S, completion of replication before M, and chromosome attachment before anaphase. |
Read a cell cycle diagram without mixing phase and division
A cell cycle diagram is a sequence of events, not a universal clock. Keep the broad cycle, mitotic stages and chromosome-count convention at different levels of detail.
Interphase is productive
G1 supports growth; S replicates DNA; G2 prepares the cell for division. Interphase is not a resting stage between two meaningful events.
Mitosis is only part of M
Prophase, metaphase, anaphase and telophase describe nuclear division. Cytokinesis divides the cytoplasm; show it without pretending that every phase boundary is sharp.
G0 is a branch, not a fifth loop segment
Place G0 outside G1 → S → G2 → M. Whether a cell can return depends on its identity and signals; do not draw a universal reversible arrow.
Common cell cycle diagram mistakes
Putting DNA replication in mitosis
Label DNA replication in S phase. Mitosis distributes previously replicated chromosomes.
Using equal arcs as equal durations
Phase duration varies by cell type and context. A balanced visual layout does not mean each phase takes the same time.
Calling 4C DNA four chromosome sets
The n notation describes chromosome sets; C describes DNA amount. A diploid G2 cell is ordinarily 2n, 4C, not 4n.
Create your own cell cycle diagram
Reading the reference is free. Generating a new draft requires an account and available credits. See current pricing.
Choose Science Drawing for an illustrated draft, or Editable Diagram for separate shapes and text labels. Review the science and all connections before using either result.
- 1
Choose the cycle scope
Specify an animal-cell overview, a checkpoint lesson or a chromosome/DNA-content comparison.
- 2
Separate cycle and mitotic details
Keep G1, S, G2 and M readable in the main cell cycle diagram. Use a second panel for mitosis stages.
- 3
Review phase labels and counts
Trace the arrows, place replication in S, and distinguish chromosome number from DNA amount before exporting.
A prompt you can adapt
Create a labeled cell cycle diagram for a typical proliferating diploid animal cell. Show G1 → S → G2 → M → daughter-cell G1 with clear directional arrows. Group G1, S and G2 as interphase; identify M as mitosis plus cytokinesis. Put G0 on a separate exit from G1 without promising re-entry for every cell. Label DNA replication only in S; use 2n/2C for G1, 2n/4C for G2 and 2n/2C per daughter after division. Put checkpoint details in a separate inset: before S, before M and spindle attachment before anaphase. Do not imply equal phase duration or use condensed X-shaped chromosomes throughout interphase.
Use this prompt in the generatorCell cycle diagram FAQ
What are the four phases in a cell cycle diagram?
The conventional active eukaryotic cycle is G1, S, G2 and M. G1, S and G2 form interphase. M includes mitosis and cytokinesis in this introductory model.
Is interphase a resting phase?
No. Cells grow, replicate DNA and prepare for division during interphase. Chromatin is generally less condensed than the chromosomes drawn during mitosis.
Where does DNA replication happen in the cell cycle?
Nuclear DNA replication happens during S phase, before mitosis. In a typical diploid model DNA amount doubles while chromosome number counted by centromeres remains 2n before sister-chromatid separation.
Where should G0 go in a cell cycle diagram?
Show G0 as a branch outside the active cycle, commonly from G1. Re-entry is possible for some cell types and conditions, but not a universal property of all differentiated cells.
Is the cell cycle the same as mitosis?
No. Mitosis is nuclear division within the M phase. The whole cell cycle also includes growth, DNA replication, preparation and cytoplasmic division.
Are all cell cycle phases the same length?
No. Duration depends on cell type, developmental stage and conditions. Do not infer timing from equal-sized diagram segments.
Can I generate an editable cell cycle diagram?
Yes. Choose Editable Diagram for separate shapes and labels, or Science Drawing for an illustrated starting draft. Generation requires an account and credits; review phases, arrows and counts.
Sources and editorial notes
Prepared by the AcaDraw product team. Source and diagram check: . This is an introductory educational model; independent expert review has not been completed. Generated drafts need checking against reliable references.
Create a cell cycle diagram for your lesson
Choose the scope, generate a draft, then review labels and connections before sharing.
Cell Cycle Diagram: Phases, Checkpoints, and DNA Changes