Biological Pathway Diagram Generator
Use the biological pathway diagram generator to organize a defined biological process into stages, participants and transitions. State the scope and cell context before choosing a layout. A biological pathway diagram can combine structures and events, while its caption explains which details are simplified or omitted.
SEE ACADRAW IN ACTION
Science drawing, from idea to editable figure
Create a science illustration with AI. Refine drawings, build editable diagrams, and convert images to SVG.
Demos play as you scroll into view. Choose a feature to explore.
Trusted by students & researchers from 480+ universities
A global community spanning 60+ countries and regions, from QS top-ranked universities to leading research institutes
























University logos belong to their respective institutions and are shown solely to illustrate our user community. They do not imply any partnership or endorsement.
Tool overview
Explore the use cases, workflow, and key things to know.
Tell a bounded process story
Choose a start, an endpoint and the events that connect them.
Track location and structure
Show when a participant changes compartment or membrane enclosure.
Explain what is omitted
A readable overview needs a clear boundary and a supporting caption.
Concept reference
Biological Pathway Diagram Generator: a worked example
This biological pathway diagram uses macroautophagy to illustrate a process map. A phagophore encloses cargo to form a double-membrane autophagosome; fusion with a lysosome leads to an autolysosome and recycling. Regulation, cargo selectivity and detailed membrane remodeling are omitted from this overview.
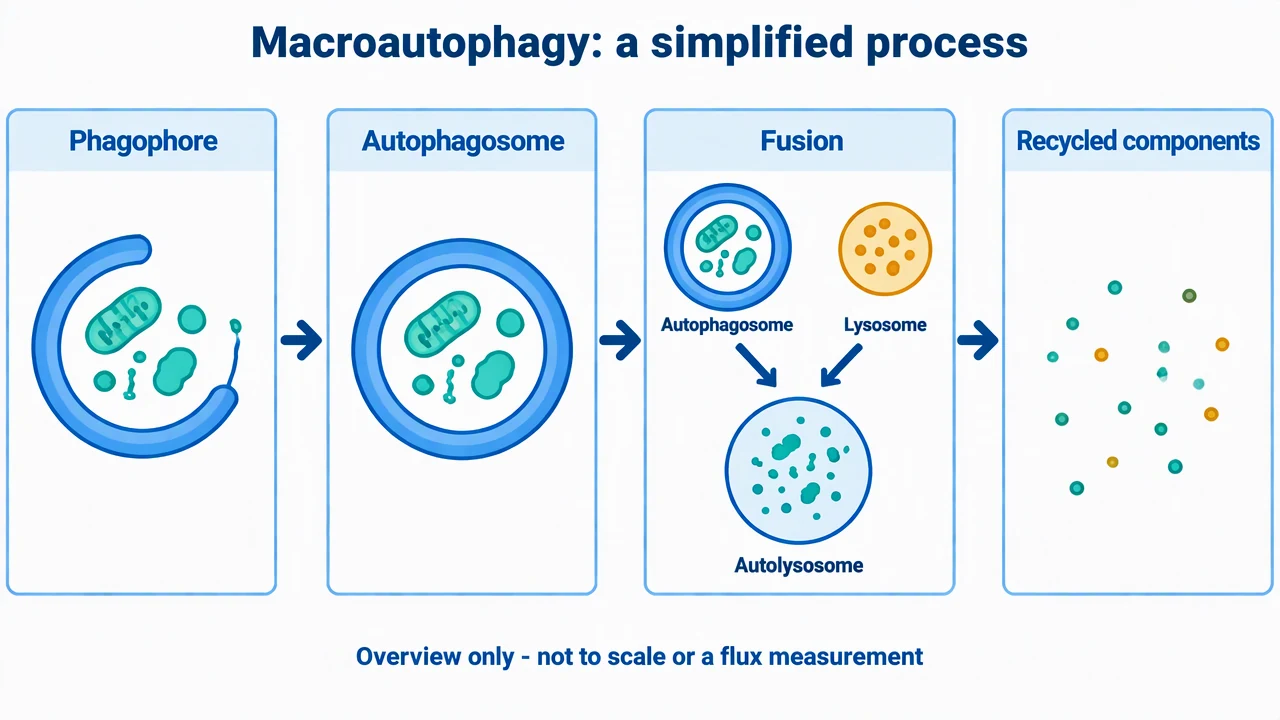
Biological Pathway Diagram Generator: reference key
Use the reference and definitions together. On a small screen, scroll the table horizontally.
| Element | Meaning | Review check |
|---|---|---|
| Process boundary | The first and last included events | State whether the figure explains a whole process or a selected subpathway. |
| Participant | A structure, molecule or cell | Use names consistently and avoid mixing scales without explanation. |
| Compartment | Where an event occurs | Show boundaries that matter for transport or fusion. |
| Transition | How one stage connects to another | Label formation, transport, fusion or degradation as appropriate. |
| Branch or convergence | A process splits or multiple inputs meet | Make the biological meaning explicit rather than adding decorative arrows. |
| Evidence note | The status of the model | Distinguish reference biology, proposed steps and actual measurements. |
Biological Pathway Diagram Generator: plan the content
Choose a biological pathway diagram when the main question concerns a process across stages or compartments. Use a signaling map for regulation and a metabolic map for chemical conversion when those are the central questions.
Choose one organizing principle
A biological pathway diagram can follow cargo, information or chemical matter. Name which one the arrows track.
Separate scale changes
A cell, organelle and protein can share a figure if the layout distinguishes those scales and explains the links.
Use the caption as part of the model
List omitted regulatory proteins and specify whether the arrows mean a typical sequence, a possible route or an experimentally tested event.
Common mistakes in a biological pathway
Using one arrow for every relationship
Fusion, activation and chemical conversion are not interchangeable. Label edges or use a small consistent key.
Equating more vesicles with higher flux
A static biological pathway diagram cannot measure autophagic flux. Vesicle abundance and the rate of degradation are different questions.
Hiding the process boundary
A cropped sequence can look like a complete pathway. Name the included stages and the relevant omissions.
Biological Pathway Diagram Generator: from brief to reviewed draft
Reading the reference is free. Generating a new draft requires an account and available credits. See current pricing.
Choose Science Drawing for an illustrated draft, or Editable Diagram for separate shapes and labels. Review all definitions, labels and connections before sharing.
- 1
Describe the process and scope
Give the biological pathway diagram generator the included stages, compartments and intended reading order.
- 2
Draft stages and transitions
Request a process-specific layout with named participants and distinguish convergence from simple progression.
- 3
Check the biological pathway diagram
Verify structures, sequence and edge meanings against the chosen sources; identify uncertain or omitted steps.
Example brief for a biological pathway
Create a macroautophagy biological pathway diagram showing phagophore enclosure, a double-membrane autophagosome, convergence with a separate lysosome to form an autolysosome, and recycling of small components. Show process order and fusion clearly. Do not draw intact organelles leaving as recycled material. Note that the image is a simplified overview, not a flux measurement.
Use this prompt in the generatorBiological Pathway Diagram Generator: common questions
What does the biological pathway diagram generator do?
It drafts a process illustration or editable pathway from your description. It does not infer a pathway from experimental measurements.
How is a biological pathway diagram different from a signaling map?
Biological pathways are a broad category. A signaling map specifically emphasizes information transfer and regulation; a process overview may emphasize transport or structural stages.
Does the autophagy example show flux?
No. It explains selected stages, not the rate of cargo delivery or degradation measured in a biological experiment.
Can the biological pathway diagram generator include hypotheses?
Yes, if proposed edges are visibly labeled and separated from established reference relationships.
Should every protein appear in the picture?
No. A focused overview can omit detail when the scope and omissions are stated and sources support the included relationships.
Sources and editorial notes
Prepared by the AcaDraw product team. Source and diagram check: . This is a simplified educational model; independent expert review has not been completed. AI-generated drafts need checking against reliable references.
Read the biological pathway guide
Choose a biological pathway diagram when the main question concerns a process across stages or compartments. Use a signaling map for regulation and a metabolic map for chemical conversion when those are the central questions.
Biological Pathway Diagrams: Processes, Compartments, and Evidence