Biogeochemical Cycle Diagram Generator
Create a biogeochemical cycle diagram that connects reservoirs such as air, soil, water and living organisms. Name the cycle you mean, then distinguish storage locations from processes that move matter between them.
SEE ACADRAW IN ACTION
Science drawing, from idea to editable figure
Create a science illustration with AI. Refine drawings, build editable diagrams, and convert images to SVG.
Demos play as you scroll into view. Choose a feature to explore.
Trusted by students & researchers from 480+ universities
A global community spanning 60+ countries and regions, from QS top-ranked universities to leading research institutes
























University logos belong to their respective institutions and are shown solely to illustrate our user community. They do not imply any partnership or endorsement.
Tool overview
Explore the use cases, workflow, and key things to know.
Name the element or resource
A biogeochemical cycle needs a defined substance, such as carbon or nitrogen.
Separate reservoirs from processes
Boxes or regions show where matter is stored; arrows show movement or transformation.
Keep the model qualitative
Do not imply quantities, rates or residence times unless a real source and scale are supplied.
Concept reference
Biogeochemical cycle diagram: reservoirs and transfers
This broad reference shows matter moving among atmosphere, water, soil, plants, animals and decomposers. It is intentionally general: carbon, nitrogen, phosphorus and water cycles use different reservoirs and transformations, so a lesson should name the specific cycle.
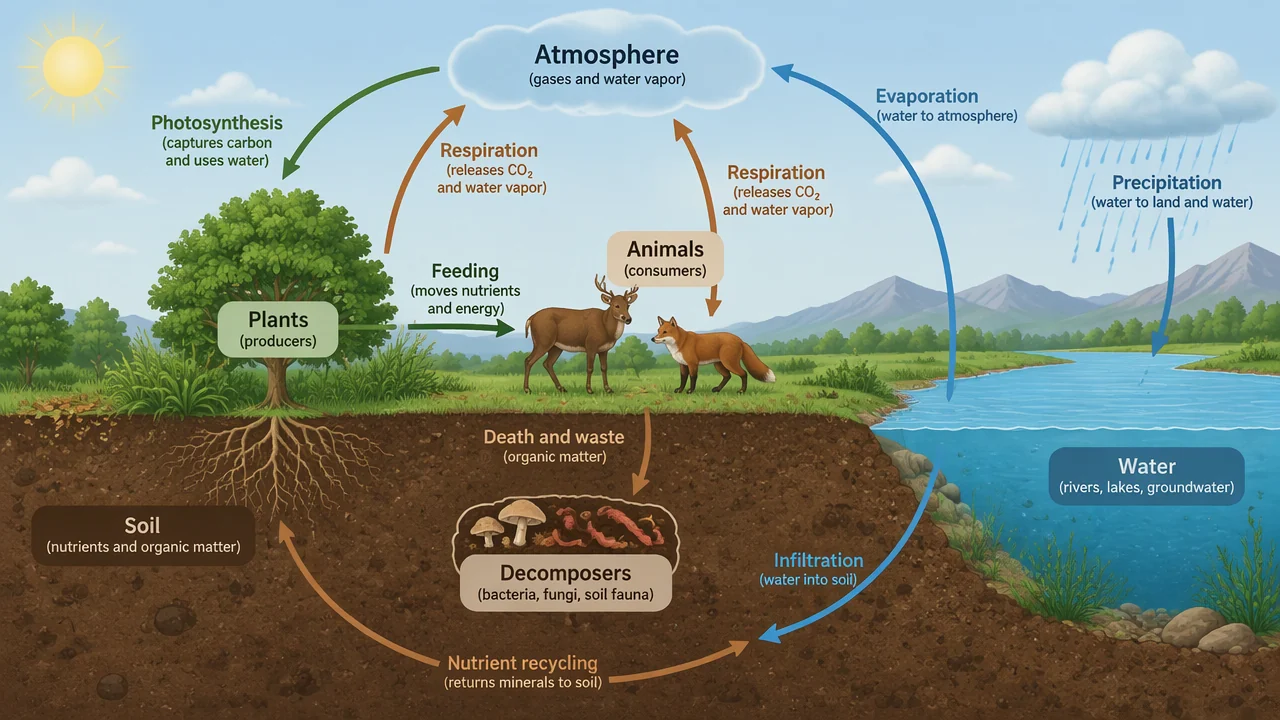
Biogeochemical cycle diagram label key
Use the reference and definitions together. On a small screen, scroll the table horizontally.
| Component | Role in a cycle | Drawing check |
|---|---|---|
| Atmosphere | A gaseous reservoir for substances such as carbon dioxide or nitrogen gas | Name the gas or form instead of treating the atmosphere as one undifferentiated pool. |
| Water | A transport and storage reservoir in oceans, lakes, soil water or precipitation | Specify the water store that participates in the chosen cycle. |
| Soil and sediment | A solid reservoir that can hold nutrients or organic matter | Do not imply that every nutrient moves at the same speed. |
| Producers | Organisms that take up matter from the environment | Photosynthesis, uptake or fixation depends on the cycle and organism. |
| Consumers | Organisms that transfer matter through feeding and metabolism | Feeding moves matter; it does not create new atoms. |
| Decomposers | Organisms that return material to soil, water or air | Label the transformation or release rather than using “recycling” as a vague arrow. |
How to make a useful biogeochemical cycle diagram
The best cycle diagrams make both storage and movement legible. A broad ecosystem picture should be followed by a focused diagram for one element.
Reservoirs are places
Atmosphere, ocean, soil, biomass and sediment are stores whose sizes and chemistry differ.
Processes are transfers
Uptake, feeding, respiration, decomposition, fixation and weathering describe movement or transformation.
Scale needs evidence
Arrow thickness, area and cycle speed should not be interpreted quantitatively without a defined dataset.
Common biogeochemical cycle diagram mistakes
Unspecified cycle
A generic “nutrient cycle” can hide important differences among carbon, nitrogen and phosphorus.
Arrow ambiguity
An arrow should identify what moves and in which direction.
False balance
A closed loop does not mean every reservoir contains equal mass or changes at the same rate.
Create your own biogeochemical cycle diagram
Reading the reference is free. Generating a new draft requires an account and available credits. See current pricing.
Choose Science Drawing for an illustrated draft, or Editable Diagram for separate shapes and labels. Review all definitions, labels and connections before sharing.
- 1
Choose the cycle
Name the element or resource and the ecosystem context.
- 2
Map stores and transfers
Place reservoirs first, then add only the processes needed for the lesson.
- 3
Audit the arrows
Check direction, terminology and whether any visual weight implies unsupported quantities.
A prompt you can adapt
Create a clean, editable biogeochemical cycle diagram for an introductory ecology lesson. Show atmosphere, water, soil, producers, consumers and decomposers as reservoirs, connect them with labeled transfer arrows, and state that the model is qualitative and not a measured mass balance.
Use this prompt in the generatorBiogeochemical Cycle diagram FAQ
What is a biogeochemical cycle?
It is the movement of matter through living systems, the atmosphere, water and geological reservoirs.
Which cycles can I illustrate?
Common examples include carbon, nitrogen, phosphorus, sulfur and the water cycle. Each needs its own process labels.
Do arrows show energy flow?
Usually they show matter movement or transformation. Energy flow is a different concept and should be labeled separately.
Can the diagram show real amounts?
Only when the input data, units, system boundary and time period are explicitly defined. This page focuses on qualitative models.
Can I edit a generated cycle?
Yes. Use Editable Diagram to move reservoirs, rename processes and review the direction of each arrow.
Sources and editorial notes
Prepared by the AcaDraw product team. Source and diagram check: . This is a simplified educational model; independent expert review has not been completed. AI-generated drafts need checking against reliable references.
Create a biogeochemical cycle diagram for your lesson
Choose the scope, generate a draft, then review labels and connections before sharing.
Biogeochemical Cycle Diagram: Reservoirs, Transfers, and Limits