Food Web Maker
Use a food web maker to connect producers, consumers and decomposers. Keep arrows pointed from food to consumer, label trophic roles and explain where the simplified model leaves out species or pathways.
SEE ACADRAW IN ACTION
Science drawing, from idea to editable figure
Create a science illustration with AI. Refine drawings, build editable diagrams, and convert images to SVG.
Demos play as you scroll into view. Choose a feature to explore.
Trusted by students & researchers from 480+ universities
A global community spanning 60+ countries and regions, from QS top-ranked universities to leading research institutes
























University logos belong to their respective institutions and are shown solely to illustrate our user community. They do not imply any partnership or endorsement.
Tool overview
Explore the use cases, workflow, and key things to know.
Define the scope
Choose the view, audience and labels before generating.
Keep relationships explicit
Use readable connectors, boundaries or arrows instead of decorative ambiguity.
Review before sharing
Check spelling, endpoints and claims against reliable references.
Concept reference
Food web reference: producers, consumers and energy flow
The food web uses arrows to show who is eaten by whom and therefore the direction of energy transfer. Multiple links show why a web contains more information than a single food chain.
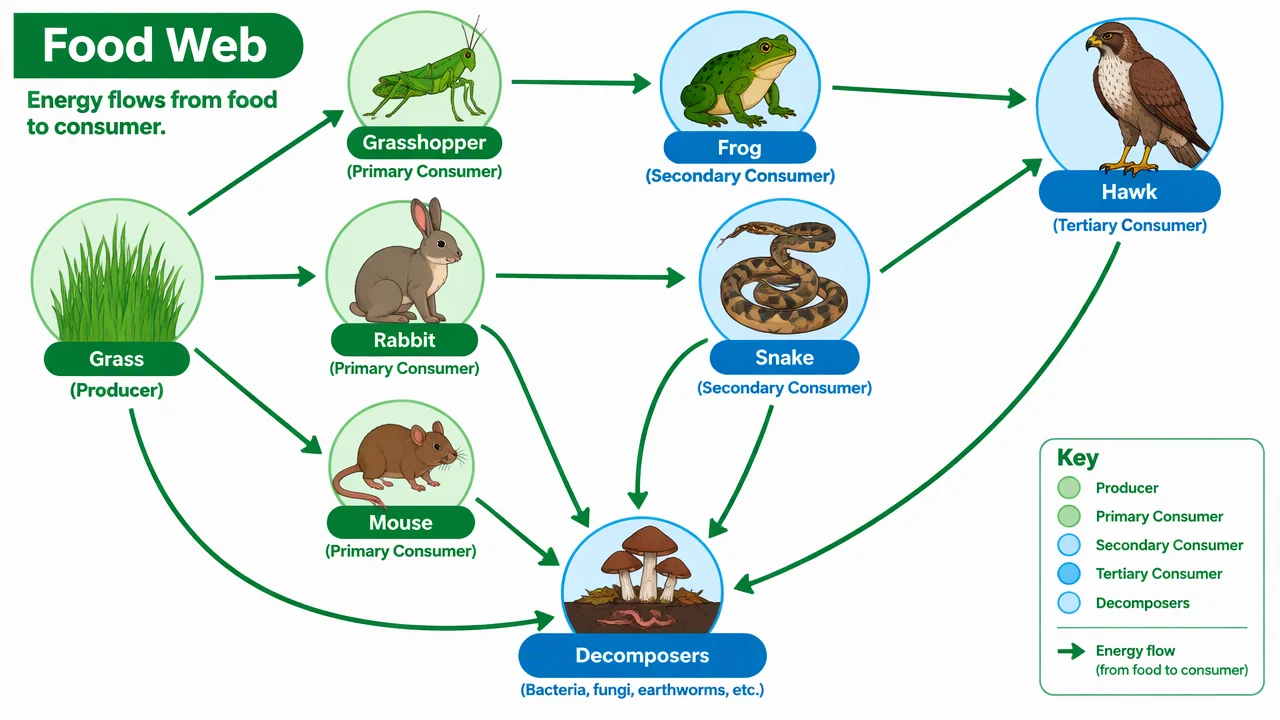
Food web label key
Use the reference and definitions together. On a small screen, scroll the table horizontally.
| Role | Example in the diagram | Meaning |
|---|---|---|
| Producer | Grass or another photosynthetic organism. | Introduces energy into the food web through primary production. |
| Primary consumer | Grasshopper, rabbit or mouse. | Feeds directly on producers in the simplified model. |
| Secondary consumer | Frog, snake or similar predator. | Feeds on primary consumers and may have more than one prey link. |
| Decomposer | Bacteria or fungi. | Breaks down organic matter and returns nutrients to the ecosystem. |
Trace a food web in the direction of energy flow
Begin with a producer, follow arrows to consumers, and identify where several chains converge or branch. Add decomposers as a connected nutrient pathway.
Arrows need a legend
Readers often reverse arrows; state whether they show energy flow or feeding direction.
Webs are selective
A classroom web omits many species and interactions for readability.
Energy and nutrients differ
Energy flows through the system while nutrients cycle back through decomposers.
Common food web mistakes
Reversing arrows
Point from the food source toward the organism that consumes it.
Calling every organism a consumer
Plants and algae are producers in the simplified trophic model.
Treating the web as complete
State the habitat and the organisms intentionally included.
Create your own food web diagram
Reading the reference is free. Generating a new draft requires an account and available credits. See current pricing.
Choose Science Drawing for an illustrated draft, or Editable Diagram for separate shapes and labels. Review all definitions, labels and connections before sharing.
- 1
Set the habitat
Choose a small ecosystem and the organisms needed for the lesson.
- 2
Connect the pathways
Draw arrows from each food source to its consumer and check direction.
- 3
Review the model
Add a legend, identify omissions and distinguish energy flow from nutrient cycling.
A prompt you can adapt
Create a clean, editable food web with grass, grasshopper, rabbit, mouse, frog, snake, hawk and decomposers. Use noncrossing arrows from food to consumer, label trophic roles and add a note that the web is a simplified qualitative model.
Use this prompt in the generatorFood Web diagram FAQ
What is a food web?
A food web is a network of connected feeding relationships in an ecosystem.
Which way should food web arrows point?
In this teaching convention, arrows point from the food source to the consumer to show energy transfer.
How is a food web different from a food chain?
A chain shows one pathway; a web shows multiple linked pathways.
Do decomposers belong in a food web?
Yes. They break down organic matter and connect the web to nutrient cycling.
Does this tool calculate ecosystem data?
No. It creates a qualitative teaching diagram; it does not estimate population counts or energy measurements.
Sources and editorial notes
Prepared by the AcaDraw product team. Source and diagram check: . This is a simplified educational model; independent expert review has not been completed. AI-generated drafts need checking against reliable references.
Create a food web diagram for your lesson
Choose the scope, generate a draft, then review labels and connections before sharing.
Food Web Maker: Connect Energy Flow and Trophic Levels