Nitrogen Cycle Diagram Generator
Create a nitrogen cycle diagram that names each transformation and shows its direction. Follow atmospheric nitrogen into biologically available forms, through plants and decomposers, and back toward the atmosphere.
SEE ACADRAW IN ACTION
Science drawing, from idea to editable figure
Create a science illustration with AI. Refine drawings, build editable diagrams, and convert images to SVG.
Demos play as you scroll into view. Choose a feature to explore.
Trusted by students & researchers from 480+ universities
A global community spanning 60+ countries and regions, from QS top-ranked universities to leading research institutes























University logos belong to their respective institutions and are shown solely to illustrate our user community. They do not imply any partnership or endorsement.
Tool overview
Explore the use cases, workflow, and key things to know.
Name every process
Use distinct nitrogen cycle diagram arrows for fixation, nitrification, assimilation, ammonification and denitrification.
Track the chemical form
Atmospheric N2, ammonium, nitrite and nitrate represent different nitrogen pools.
Keep the model qualitative
Explain relationships without implying measured flux, fertilizer advice or a complete ecosystem budget.
Concept reference
Nitrogen cycle diagram: connect stores with named processes
This nitrogen cycle diagram is a simplified terrestrial model. It separates atmospheric nitrogen, reduced soil nitrogen, nitrite, nitrate and organic nitrogen. Arrows describe transformations or transfers, not measured fluxes. Microbial roles vary by environment; anammox and several additional routes are omitted.
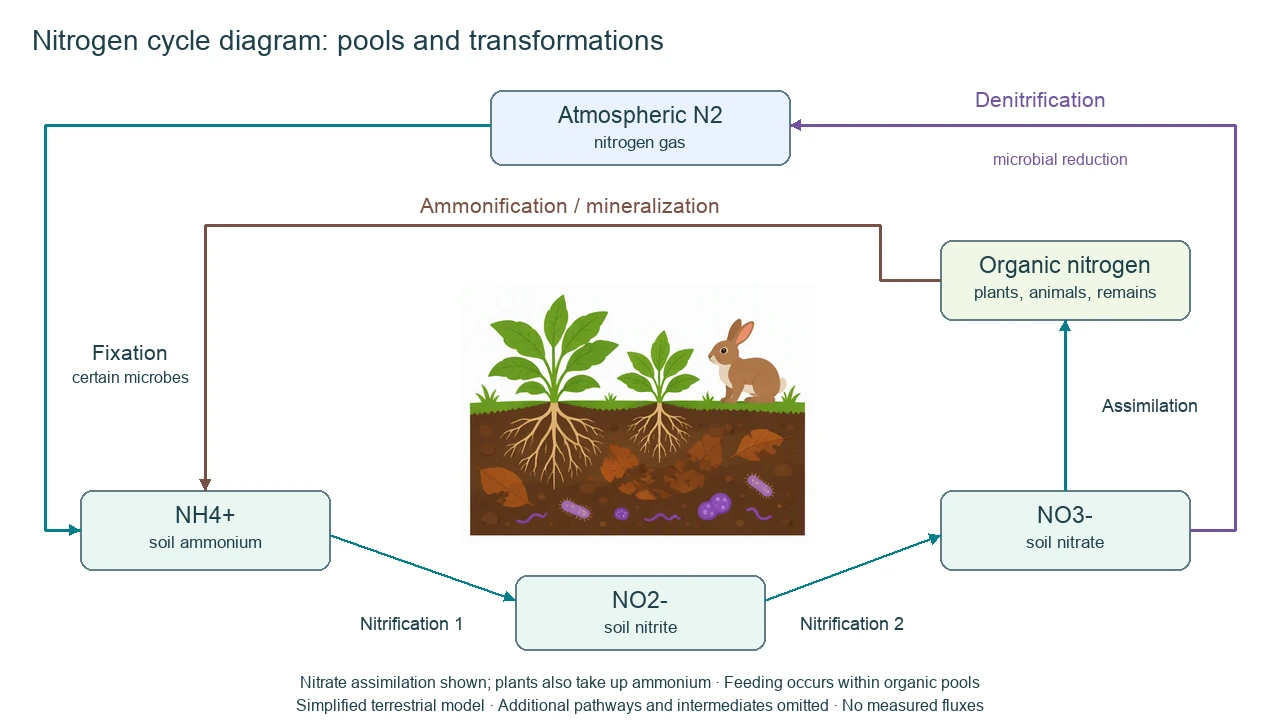
Nitrogen cycle diagram processes and direction
Use the reference and definitions together. On a small screen, scroll the table horizontally.
| Label or process | Position or relationship | Meaning and drawing check |
|---|---|---|
| Nitrogen fixation | Atmospheric N2 → reduced nitrogen | Certain microbes convert N2 to ammonia, which is largely present as ammonium under many soil conditions. |
| Nitrification, first step | Ammonium → nitrite | Microbial oxidation; an oxygen-requiring route in this introductory soil model. |
| Nitrification, second step | Nitrite → nitrate | Further microbial oxidation, distinct from fixation and denitrification. |
| Assimilation | Ammonium or nitrate → organic nitrogen | Plants take up available nitrogen and incorporate it into organic compounds; animals obtain nitrogen through food. |
| Ammonification | Organic nitrogen → ammonium | Decomposition and mineralization return reduced nitrogen to the soil pool. |
| Denitrification | Nitrate → gaseous nitrogen products | Microbial reduction under low-oxygen conditions can return N2 to the atmosphere; intermediates are simplified. |
Follow a nitrogen cycle diagram without merging the arrows
A nitrogen cycle diagram represents a network rather than one compulsory loop for every nitrogen atom. Conditions determine which pathways operate.
Fixation is not nitrification
Fixation makes atmospheric N2 biologically available; nitrification oxidizes reduced nitrogen already in the system.
Plants do not generally absorb atmospheric N2 directly
Roots take up available forms such as nitrate and ammonium. Symbiotic microbes can supply fixed nitrogen to host plants.
Oxygen conditions change microbial routes
Nitrification is associated with oxygenated environments in this model; denitrification is favored by low oxygen and suitable substrates.
Common nitrogen cycle diagram mistakes
Drawing plants directly absorbing N2
Label fixation as a microbial process before ordinary plant uptake in the model.
Reversing nitrification and denitrification
Nitrification goes toward nitrate; denitrification reduces nitrate toward gaseous products.
Treating one arrow as an annual quantity
The nitrogen cycle diagram shows process directions, not measured nitrogen masses or rates.
Create your own nitrogen cycle diagram
Reading the reference is free. Generating a new draft requires an account and available credits. See current pricing.
Choose Science Drawing for an illustrated draft, or Editable Diagram for separate shapes and labels. Review all definitions, labels and connections before sharing.
- 1
Choose the ecosystem
Request a terrestrial nitrogen cycle diagram or name a different environment explicitly.
- 2
Build the pool list
Separate N2, ammonium, nitrite, nitrate and organic nitrogen before drawing arrows.
- 3
Audit every arrow
Read source → process → destination and check chemical forms and microbial roles.
A prompt you can adapt
Create a qualitative terrestrial nitrogen cycle diagram. Use separate pools for atmospheric N2, soil NH4+, NO2−, NO3− and organic nitrogen. Draw directed arrows: fixation N2 to reduced nitrogen; nitrification NH4+ to NO2− to NO3−; assimilation ammonium and nitrate into organic nitrogen; ammonification organic nitrogen to ammonium; denitrification nitrate toward atmospheric N2. Name microbial roles. Add plants, animals and decomposers as context, with animal nitrogen obtained through feeding. Note that intermediates and anammox are omitted; no measured fluxes or fertilizer recommendations.
Use this prompt in the generatorNitrogen cycle diagram FAQ
What should a nitrogen cycle diagram show?
A basic nitrogen cycle diagram shows nitrogen pools and arrows for fixation, nitrification, assimilation, ammonification and denitrification.
How do fixation and nitrification differ?
Fixation converts atmospheric N2 into reduced nitrogen. Nitrification oxidizes ammonium through nitrite to nitrate in the simplified aerobic soil model.
Can plants take nitrogen directly from the air?
Most plants use nitrogen forms taken up through roots, such as nitrate and ammonium. Nitrogen-fixing microbes can provide fixed nitrogen, including in symbioses.
What returns nitrogen to the atmosphere?
Denitrification can reduce nitrate through intermediates to gaseous products including N2. Other routes also exist but are omitted here.
Is ammonification the same as assimilation?
No. Ammonification releases ammonium from organic nitrogen; assimilation incorporates available nitrogen into organic compounds.
Can I edit the labels and arrows?
Yes. Choose Editable Diagram for separate shapes and text. Check every direction before sharing. Generation requires an account and credits.
Sources and editorial notes
Prepared by the AcaDraw product team. Source and diagram check: . This is a simplified educational model; independent expert review has not been completed. AI-generated drafts need checking against reliable references.
Create a nitrogen cycle diagram for your lesson
Choose the scope, generate a draft, then review labels and connections before sharing.
Nitrogen Cycle Diagram: Five Processes and the Microbes Behind Them