Punnett Square Maker
Use a Punnett square maker to organize a simple genetic cross. Separate parent gametes from offspring genotypes, then explain which phenotype categories follow from the stated dominance model.
SEE ACADRAW IN ACTION
Science drawing, from idea to editable figure
Create a science illustration with AI. Refine drawings, build editable diagrams, and convert images to SVG.
Demos play as you scroll into view. Choose a feature to explore.
Trusted by students & researchers from 480+ universities
A global community spanning 60+ countries and regions, from QS top-ranked universities to leading research institutes
























University logos belong to their respective institutions and are shown solely to illustrate our user community. They do not imply any partnership or endorsement.
Tool overview
Explore the use cases, workflow, and key things to know.
Define the scope
Choose the view, audience and labels before generating.
Keep relationships explicit
Use readable connectors, boundaries or arrows instead of decorative ambiguity.
Review before sharing
Check spelling, endpoints and claims against reliable references.
Labeled teaching reference
Punnett square reference: alleles, genotypes and phenotypes
A two-by-two Punnett square combines one allele from each parent in every offspring box. The example shows a simple heterozygous cross and distinguishes genotype combinations from the phenotype categories that depend on the trait model.
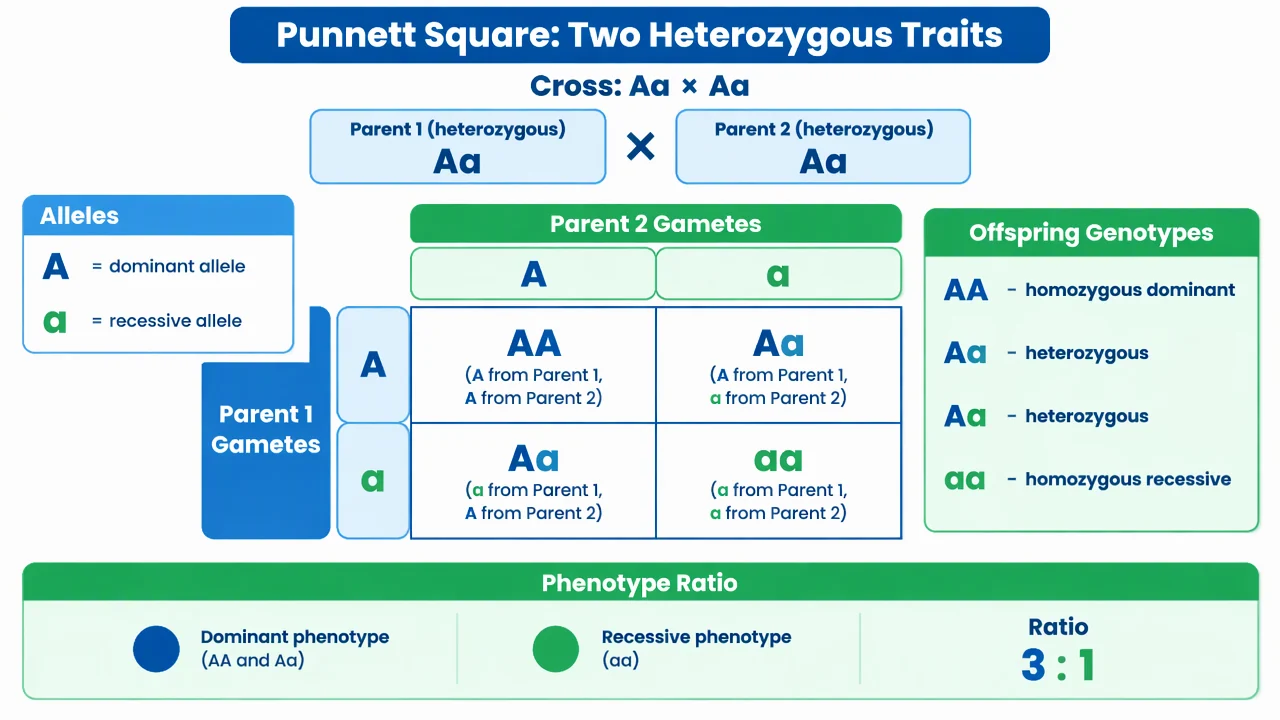
Punnett square label key
Use the labels with the reference, then choose the detail level your lesson needs. On a small screen, scroll the table horizontally.
| Part | What it contains | Check before sharing |
|---|---|---|
| Parent genotypes | The allele pair carried by each parent. | State whether each parent is homozygous or heterozygous. |
| Gametes | One allele contributed by each parent. | Place one parent across the top and the other down the side. |
| Offspring boxes | One combined genotype per box. | Check that every combination is represented once. |
| Phenotype | The observable category implied by the model. | State the dominance assumptions; do not treat the ratio as a guarantee. |
Separate genotype combinations from phenotype claims
Fill the parent alleles first, combine one allele from each side, and only then map genotypes to phenotypes using the stated inheritance rule.
The grid is a model
A four-box cross represents possible combinations under its assumptions, not a guaranteed family outcome.
Dominance must be stated
Complete dominance, codominance and sex linkage require different interpretations.
Probability is conditional
The ratio applies to the defined cross and assumptions, not to every population.
Common Punnett square mistakes
Confusing genotype and phenotype
List allele combinations separately from visible trait categories.
Using the wrong gametes
A heterozygous parent contributes two allele types; a homozygous parent contributes one.
Overstating the ratio
Describe expected proportions as model outcomes, not certainty for a small family.
Create your own punnett square diagram
Reading the reference is free. Generating a new draft requires an account and available credits. See current pricing.
Choose Science Drawing for an illustrated draft, or Editable Diagram for separate shapes and text labels. Review the science and all connections before using either result.
- 1
State the trait model
Name the alleles and dominance rule before drawing the grid.
- 2
Fill the gametes
Place one allele set across the top and the other down the side.
- 3
Interpret carefully
Separate genotype counts from phenotype categories and explain the limits.
A prompt you can adapt
Create a clean, editable Punnett square for a simple heterozygous cross. Label parent genotypes, gametes, all offspring genotypes and the phenotype categories, and state that the ratio is conditional on the inheritance assumptions.
Use this prompt in the generatorPunnett Square diagram FAQ
What does a Punnett square show?
It organizes possible allele combinations from two parents for a defined genetic cross.
Is a Punnett square a guarantee?
No. It gives expected combinations under the stated assumptions; it does not predict an individual with certainty.
What is the difference between genotype and phenotype?
Genotype is the allele combination; phenotype is the observed trait produced through the genetic and environmental context.
Can I model codominance?
Yes, but use the appropriate phenotype interpretation and label both alleles clearly.
Can I make a blank worksheet?
Yes. Keep one labeled answer key and remove the offspring entries from a duplicate.
Sources and editorial notes
Prepared by the AcaDraw product team. Source and diagram check: . This is an introductory educational model; independent expert review has not been completed. Generated drafts need checking against reliable references.
Create a punnett square diagram for your lesson
Choose the scope, generate a draft, then review labels and connections before sharing.
Punnett Square Maker: From Parent Alleles to Offspring Traits