PRISMA Flow Diagram Generator
Use a PRISMA flow diagram generator to draft the stages of a systematic review. Keep records identified, duplicates removed, records screened, full texts assessed and studies included in separate boxes, then enter and verify your own counts.
SEE ACADRAW IN ACTION
Science drawing, from idea to editable figure
Create a science illustration with AI. Refine drawings, build editable diagrams, and convert images to SVG.
Demos play as you scroll into view. Choose a feature to explore.
Trusted by students & researchers from 480+ universities
A global community spanning 60+ countries and regions, from QS top-ranked universities to leading research institutes
























University logos belong to their respective institutions and are shown solely to illustrate our user community. They do not imply any partnership or endorsement.
Tool overview
Explore the use cases, workflow, and key things to know.
Keep stages separate
A reader should be able to distinguish identification, screening, eligibility and inclusion.
Track exclusions
Use side branches to show where records were removed and why.
Verify the counts
A generated layout cannot validate your search log or eligibility decisions.
Concept reference
PRISMA flow diagram reference: identification to inclusion
This template separates identification, screening, eligibility and inclusion. The numbers are placeholders for layout guidance only; a real review must replace them with counts from its search, deduplication and eligibility records.
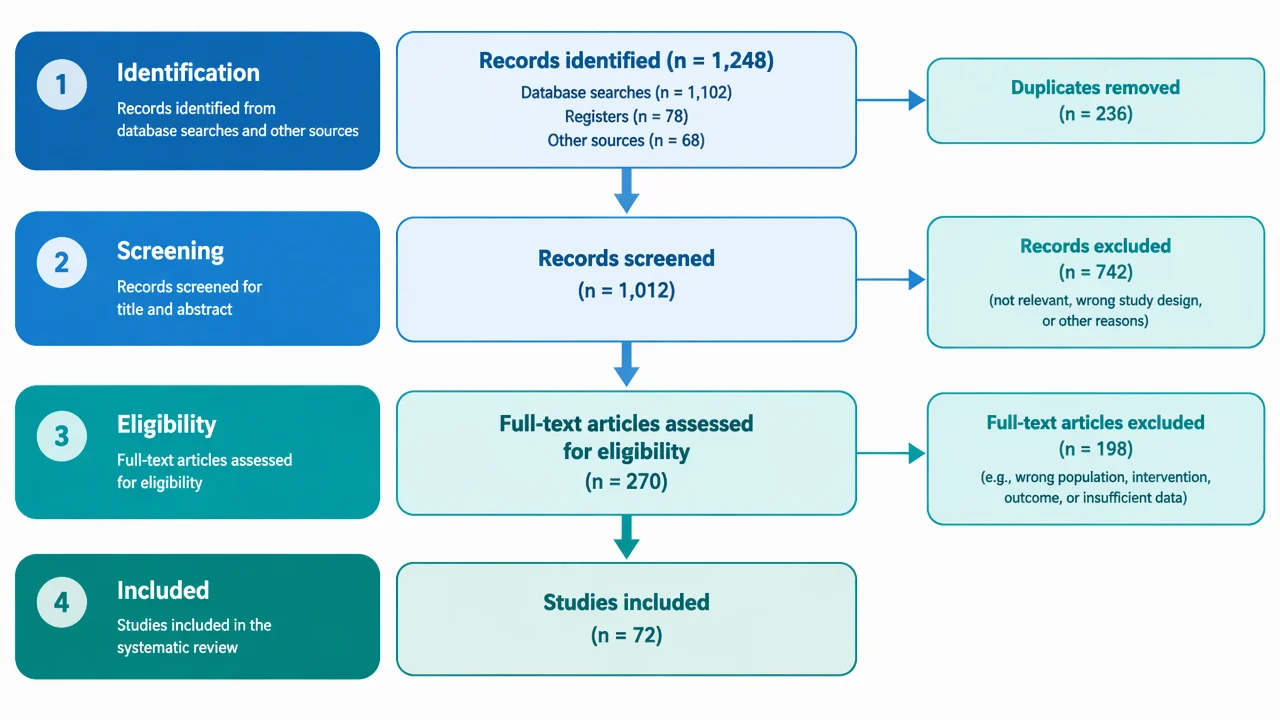
PRISMA flow diagram label key
Use the reference and definitions together. On a small screen, scroll the table horizontally.
| Stage | Typical content | Verification check |
|---|---|---|
| Identification | Records from databases, registers and other sources | Record each source and the date searched. |
| Duplicate removal | Records removed before screening | State the deduplication method and whether automation was used. |
| Screening | Titles and abstracts assessed | The number screened should match the records remaining after deduplication. |
| Eligibility | Full-text reports assessed | Give exclusion reasons and keep them mutually understandable. |
| Included | Studies or reports included in the review | Separate studies from reports when one study has multiple reports. |
Build a PRISMA flow diagram from an audit trail
A PRISMA diagram is a summary of review decisions. It becomes trustworthy when every number can be traced back to a search export, screening record or eligibility log.
Use one unit at a time
Decide whether a box counts records, reports or studies and label the choice.
Explain exclusions
A short reason beside each branch makes the eligibility step auditable.
Keep placeholders visible
If the diagram is a draft, mark sample counts clearly so they are not mistaken for results.
Common PRISMA diagram mistakes
Mixed counting units
Switching between records, reports and studies without labels makes totals impossible to interpret.
Missing duplicate step
The screening denominator should reflect what remained after duplicate removal.
Unverified totals
A polished diagram does not prove that the counts reconcile with the review log.
Create your own prisma flow diagram diagram
Reading the reference is free. Generating a new draft requires an account and available credits. See current pricing.
Choose Science Drawing for an illustrated draft, or Editable Diagram for separate shapes and labels. Review all definitions, labels and connections before sharing.
- 1
Define the unit
Choose records, reports or studies and keep that unit consistent.
- 2
Reconcile the log
Calculate each stage from the search and screening records you actually have.
- 3
Publish with transparency
Replace placeholders, add reasons and cite the reporting guideline version used.
A prompt you can adapt
Create an editable PRISMA flow diagram template with Identification, Screening, Eligibility and Included stages. Add side branches for duplicates removed and full-text exclusions, use clearly marked placeholder counts, and leave room for exclusion reasons.
Use this prompt in the generatorPRISMA Flow Diagram diagram FAQ
What is a PRISMA flow diagram?
It summarizes how records move through identification, screening, eligibility and inclusion in a systematic review.
Does the generator calculate my review counts?
No. It creates an editable layout; you must enter and reconcile counts from your own review records.
What does n mean?
“n” indicates the number counted in a box. Define whether that count refers to records, reports or studies.
Can I show reasons for exclusion?
Yes. Use side branches or notes for full-text exclusion reasons and keep them consistent with the screening log.
Can I edit the generated diagram?
Yes. Editable Diagram mode is intended for moving boxes, changing counts and adding notes.
Sources and editorial notes
Prepared by the AcaDraw product team. Source and diagram check: . This is a simplified educational model; independent expert review has not been completed. AI-generated drafts need checking against reliable references.
Create a prisma flow diagram diagram for your lesson
Choose the scope, generate a draft, then review labels and connections before sharing.
PRISMA Flow Diagram Generator: Make Review Decisions Traceable