Meiosis Diagram Generator
Create a labeled meiosis diagram that keeps meiosis I and meiosis II separate. Show homologous chromosomes, sister chromatids and the four haploid products without mixing chromosome number with DNA amount.
SEE ACADRAW IN ACTION
Science drawing, from idea to editable figure
Create a science illustration with AI. Refine drawings, build editable diagrams, and convert images to SVG.
Demos play as you scroll into view. Choose a feature to explore.
Trusted by students & researchers from 480+ universities
A global community spanning 60+ countries and regions, from QS top-ranked universities to leading research institutes






















University logos belong to their respective institutions and are shown solely to illustrate our user community. They do not imply any partnership or endorsement.
Tool overview
Explore the use cases, workflow, and key things to know.
Keep the two divisions distinct
Meiosis I separates homologous chromosomes; meiosis II separates sister chromatids.
Track ploidy deliberately
The products are haploid, but chromosome and DNA counts depend on the stage being described.
Show variation carefully
Crossing over and independent assortment contribute to variation; the simplified panel does not model every crossover.
Labeled teaching reference
Meiosis diagram: stages, chromosome separation, and four haploid products
This meiosis diagram follows one homologous pair (2n = 2) through two divisions. Meiosis I separates the blue and red homologs while sister chromatids stay joined. Meiosis II separates the sister chromatids into four haploid products (n = 1). Crossing over is omitted to keep chromosome tracking clear; the final panel groups anaphase II through telophase II.
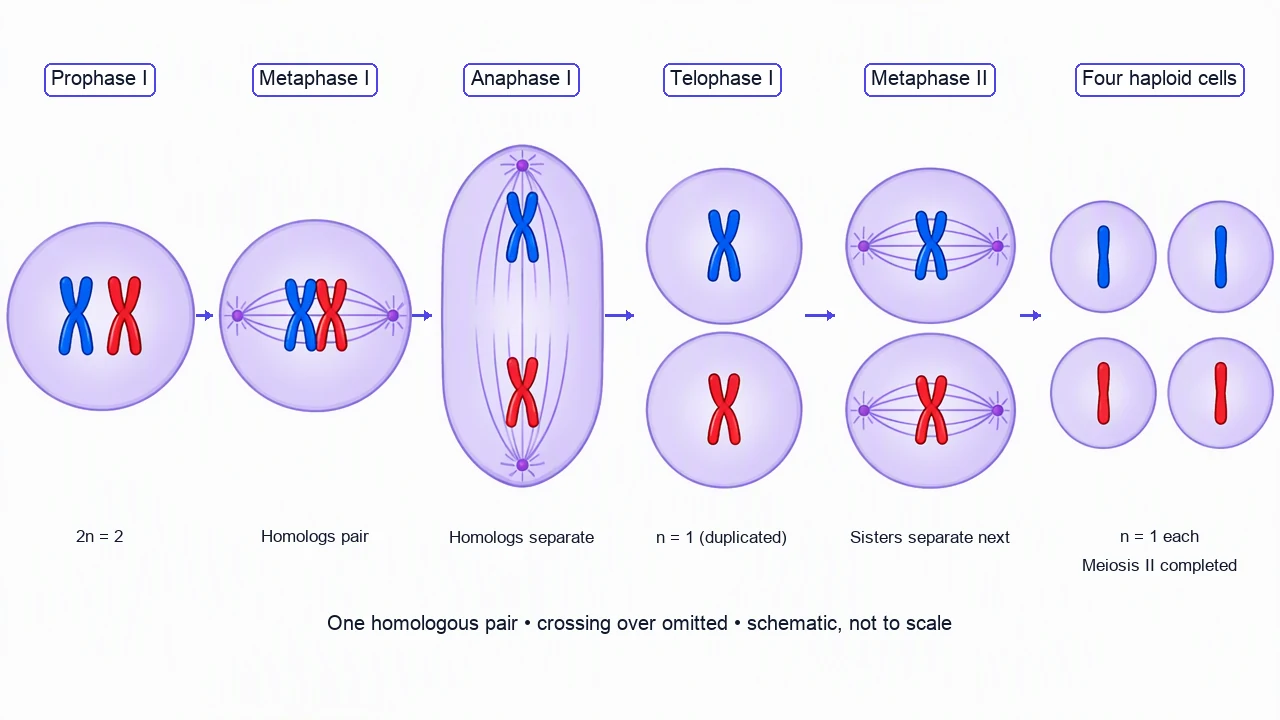
Meiosis diagram labels and stage checks
Use the labels with the reference, then choose the detail level your lesson needs. On a small screen, scroll the table horizontally.
| Stage or structure | What happens in this model | What to label or verify |
|---|---|---|
| Prophase I | Homologous chromosomes pair and may exchange segments | Show paired homologs and crossing-over only when the lesson includes it. |
| Metaphase I | Homologous pairs align at the equator | The pair, not each sister chromatid, is oriented toward opposite poles. |
| Anaphase I | Homologs move to opposite poles | Sister chromatids remain joined in this division. |
| Telophase I / cytokinesis | Two cells form after the first division | Each cell has one chromosome from each homologous pair, with duplicated chromatids. |
| Metaphase II | Chromosomes align in each of the two cells | There is no second round of homolog pairing like prophase I. |
| Anaphase II to products | Sister chromatids separate and four haploid cells result | The final products are haploid; chromosome appearance varies with the organism and stage. |
Read meiosis as two linked divisions
A meiosis diagram is easiest to check when the first division and second division answer different questions.
Meiosis I reduces homolog pairs
Pairing and homolog separation reduce the chromosome-set number in each daughter cell.
Meiosis II resembles mitosis in one key action
Sister chromatids separate, but the starting cells are already haploid after meiosis I.
Variation is not one arrow
Crossing over, independent assortment and random fertilization are related sources of variation, but a six-panel diagram may show only the first two.
Common meiosis diagram mistakes
Separating sister chromatids in anaphase I
Anaphase I separates homologous chromosomes; sister chromatids remain together until anaphase II.
Drawing one division instead of two
A complete meiosis overview needs both meiosis I and meiosis II before the four products.
Calling the products diploid
The conventional outcome is four haploid products, though the exact biological products depend on the organism and context.
Create your own meiosis diagram
Reading the reference is free. Generating a new draft requires an account and available credits. See current pricing.
Choose Science Drawing for an illustrated draft, or Editable Diagram for separate shapes and text labels. Review the science and all connections before using either result.
- 1
Set the organism and scope
State whether the diagram is a general animal meiosis overview, gamete formation lesson or a chromosome-count exercise.
- 2
Draw the two divisions as two questions
Use meiosis I for homologs and meiosis II for sister chromatids.
- 3
Audit the final products
Trace chromosome colors, ploidy and the number of products before exporting.
A prompt you can adapt
Create a meiosis diagram using one homologous pair (2n = 2): one blue duplicated chromosome and one red duplicated chromosome. Use six panels: prophase I, metaphase I, anaphase I, telophase I, metaphase II, and four haploid products (n = 1). Keep sister chromatids joined in anaphase I. Each cell after meiosis I has one duplicated chromosome; each final product has one single chromatid chromosome. Omit crossing over for this introductory model and label that omission. Use clear arrows and keep chromosome counts consistent.
Use this prompt in the generatorMeiosis diagram FAQ
What are the main stages in a meiosis diagram?
A full overview includes prophase I, metaphase I, anaphase I, telophase I, then prophase II, metaphase II, anaphase II and telophase II. Introductory diagrams often group some stages for clarity.
What separates in meiosis I?
Homologous chromosomes separate in meiosis I. Sister chromatids generally remain joined until meiosis II.
What separates in meiosis II?
Sister chromatids separate in meiosis II, producing haploid cells or products.
How many cells result from meiosis?
The conventional overview ends with four haploid products, although the exact functional products and cell divisions vary among organisms.
How is meiosis different from mitosis?
Meiosis includes two divisions and reduces chromosome-set number, while mitosis usually produces two genetically similar daughter cells with the same chromosome-set number as the parent.
Does every meiosis diagram need crossing over?
Not every overview needs to draw a crossover, but if genetic variation is the lesson, label crossing over as a process in prophase I and distinguish it from independent assortment.
Sources and editorial notes
Prepared by the AcaDraw product team. Source and diagram check: . This is an introductory educational model; independent expert review has not been completed. Generated drafts need checking against reliable references.
Create a meiosis diagram for your lesson
Choose the scope, generate a draft, then review labels and connections before sharing.
Meiosis Diagram: Stages, Chromosome Behavior, and Four Haploid Products