Food Chain Diagram Generator
Create a food chain diagram with a clear feeding sequence. Distinguish energy input, producer, consumer levels and decomposer recycling without treating the simplified chain as a complete food web.
SEE ACADRAW IN ACTION
Science drawing, from idea to editable figure
Create a science illustration with AI. Refine drawings, build editable diagrams, and convert images to SVG.
Demos play as you scroll into view. Choose a feature to explore.
Trusted by students & researchers from 480+ universities
A global community spanning 60+ countries and regions, from QS top-ranked universities to leading research institutes






















University logos belong to their respective institutions and are shown solely to illustrate our user community. They do not imply any partnership or endorsement.
Tool overview
Explore the use cases, workflow, and key things to know.
Start with the producer
Plants capture energy and form the base of this simplified chain.
Read arrows consistently
Use arrows to show the direction chosen in the legend, such as energy flow or “is eaten by.”
Keep chain and web separate
A food web includes branching connections that a single chain omits.
Concept reference
Food chain diagram: sun, grass, grasshopper, frog, snake, hawk and decomposer
This food chain diagram is a qualitative meadow example. Arrows show a simplified feeding relationship; they do not quantify population size, biomass or energy transfer.
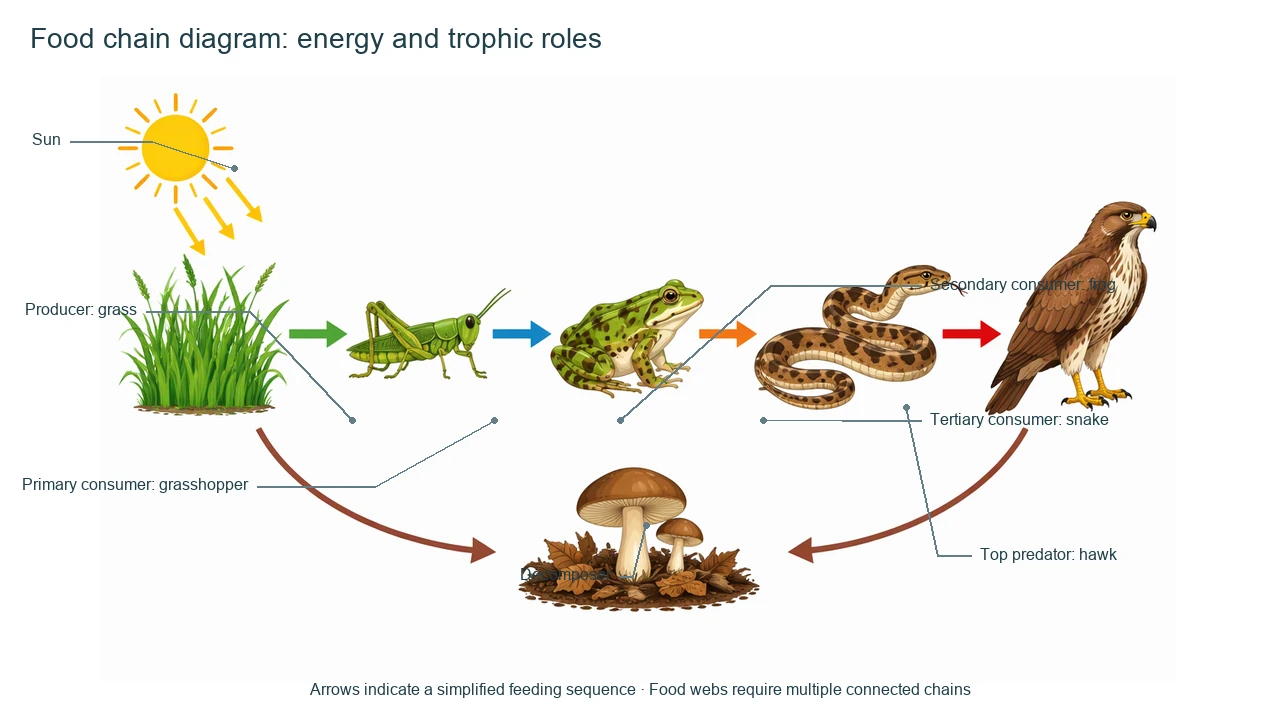
Food Chain reference key
Use the reference and definitions together. On a small screen, scroll the table horizontally.
| Label or stage | Position or relationship | Meaning and drawing check |
|---|---|---|
| Sun | Energy input | The Sun supplies the energy source for this example chain. |
| Producer: grass | First living level | Grass converts light energy into stored chemical energy. |
| Primary consumer: grasshopper | Eats the producer | The grasshopper represents a herbivore in this meadow example. |
| Secondary consumer: frog | Eats a primary consumer | The frog is an insect-eating consumer in the simplified chain. |
| Tertiary consumer: snake | Higher consumer | The snake is shown as a predator; actual diets vary by species and habitat. |
| Top predator: hawk | Upper consumer in this example | “Top” is local to the selected chain, not a universal ecosystem rank. |
| Decomposer | Recycles organic matter | Fungi and microbes break down remains and return nutrients to the ecosystem. |
Read the food chain by role and arrow
Identify the producer first, then follow each feeding relationship and finish with decomposer recycling.
Energy and nutrients differ
Energy flows through the chain while nutrients cycle through organisms and the environment.
A chain is a slice of a web
Real ecosystems usually contain many branching and overlapping feeding relationships.
Roles depend on context
An organism can occupy different trophic roles in different food chains.
Common food chain mistakes
Reversing the arrow meaning
Add a legend so readers know whether arrows mean energy flow or “is eaten by.”
Calling decomposers the final consumer
Decomposers process organic matter rather than simply occupying another predator level.
Treating the chain as complete
State that this is one simplified chain from a larger food web.
Create your own food chain diagram
Reading the reference is free. Generating a new draft requires an account and available credits. See current pricing.
Choose Science Drawing for an illustrated draft, or Editable Diagram for separate shapes and labels. Review all definitions, labels and connections before sharing.
- 1
Set the habitat
Choose a meadow or another explicit ecosystem before selecting organisms.
- 2
Choose arrow meaning
Use one consistent direction and write the legend on the figure.
- 3
Add the scope note
Explain that a food chain is a simplified path through a broader food web.
A prompt you can adapt
Create a labeled food chain diagram for a meadow. Show Sun, grass as producer, grasshopper as primary consumer, frog as secondary consumer, snake as higher consumer, hawk as top predator in this example and a mushroom decomposer. Add arrows with a legend and state that the model is qualitative, not measured data.
Use this prompt in the generatorFood Chain diagram FAQ
What is a food chain?
A food chain is a simplified sequence of feeding relationships in an ecosystem.
What is a producer?
A producer, such as grass, makes organic matter from an energy source such as sunlight.
What do arrows show?
They can show energy flow or feeding direction; the diagram should define its convention.
What do decomposers do?
They break down organic matter and help recycle nutrients.
Is a food chain the same as a food web?
No. A food web combines many connected food chains.
Sources and editorial notes
Prepared by the AcaDraw product team. Source and diagram check: . This is a simplified educational model; independent expert review has not been completed. AI-generated drafts need checking against reliable references.
Create a food chain diagram for your lesson
Choose the scope, generate a draft, then review labels and connections before sharing.
Food Chain Diagram: Producers, Consumers, and Decomposers