CONSORT Flow Diagram Generator
Use a CONSORT flow diagram generator to draft participant flow through enrollment, randomization, allocation, follow-up and analysis. Start from your verified trial records, keep each trial arm distinct and explain missing data instead of assuming everyone lost to follow-up was excluded from analysis.
SEE ACADRAW IN ACTION
Science drawing, from idea to editable figure
Create a science illustration with AI. Refine drawings, build editable diagrams, and convert images to SVG.
Demos play as you scroll into view. Choose a feature to explore.
Trusted by students & researchers from 480+ universities
A global community spanning 60+ countries and regions, from QS top-ranked universities to leading research institutes
























University logos belong to their respective institutions and are shown solely to illustrate our user community. They do not imply any partnership or endorsement.
Tool overview
Explore the use cases, workflow, and key things to know.
Report what happened
Counts should come from eligibility, allocation and follow-up records. A template is not evidence that the trial followed that sequence.
Separate follow-up from analysis
An intention-to-treat strategy may retain participants with missing follow-up using an appropriate stated method. Do not subtract losses automatically.
Choose the correct guideline
A simple two-arm parallel trial is only one design. Consult current CONSORT guidance and relevant extensions for other designs.
Check participant count arithmetic
Enter counts from a two-arm parallel randomized trial. This checks arithmetic only; it does not validate trial conduct or CONSORT compliance.
Local checker · no information is uploaded
These counts pass the arithmetic checks. Verify reasons, denominators and the analysis population against your trial records.
Analyzed is not automatically allocated minus lost to follow-up. An intention-to-treat analysis can include participants with missing outcomes using a stated method. Describe that method and any exclusions.
Concept reference
CONSORT Flow Diagram: a worked example
The fictional example assesses 120 people, excludes 20 and randomizes 100 into two arms of 50. Follow-up losses are shown separately; analysis retains all 50 randomized participants per arm under an explicitly stated missing-data approach. These are teaching counts, not a real trial.
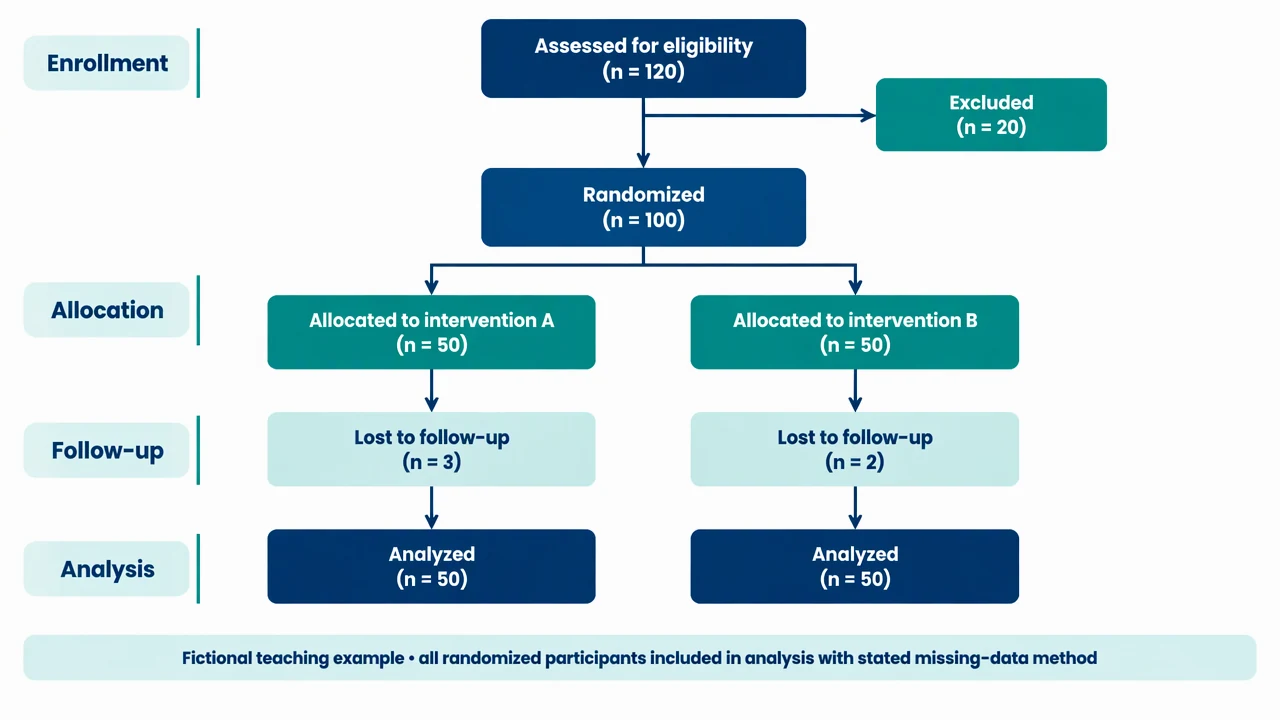
CONSORT Flow Diagram reference key
Use the reference and definitions together. On a small screen, scroll the table horizontally.
| Element | Meaning | Review check |
|---|---|---|
| Enrollment | Assessed and excluded before randomization | Explain exclusions and reconcile assessed minus excluded with randomized. |
| Randomization | Participants assigned to trial arms | Check that allocated totals equal the randomized population. |
| Allocation | Participants allocated to each intervention | Report receipt of intervention and reasons for nonreceipt where relevant. |
| Follow-up | Losses and discontinuations by arm | Follow-up loss does not automatically mean exclusion from analysis. |
| Analysis | Participants included in each defined analysis | State the population, exclusions and missing-data methods. |
Plan your consort flow diagram
Keep participant flow separate from trial outcomes, and distinguish follow-up status from analysis membership.
Report what happened
Counts should come from eligibility, allocation and follow-up records. A template is not evidence that the trial followed that sequence.
Separate follow-up from analysis
An intention-to-treat strategy may retain participants with missing follow-up using an appropriate stated method. Do not subtract losses automatically.
Choose the correct guideline
A simple two-arm parallel trial is only one design. Consult current CONSORT guidance and relevant extensions for other designs.
Common mistakes to avoid
Arms that do not add up
Allocated counts should reconcile with randomized participants under the stated design.
Lost equals excluded
Participants lost to follow-up may still belong in a defined analysis population.
Template treated as compliance
A flow diagram alone does not establish reporting completeness, trial quality or guideline compliance.
CONSORT Flow Diagram Generator: from brief to checked draft
Reading the reference is free. Generating a new draft requires an account and available credits. See current pricing.
Choose Science Drawing for an illustrated draft, or Editable Diagram for separate shapes and labels. Review all definitions, labels and connections before sharing.
- 1
Confirm the trial design
Choose the applicable guideline and collect verified participant counts.
- 2
Check counts and reasons
Reconcile enrollment and allocation, then document follow-up and analysis separately.
- 3
Draft the flow diagram
Generate the layout and compare every box with the trial records and reporting checklist.
A prompt you can adapt
Create an editable flow diagram for a fictional two-arm parallel trial: assessed 120, excluded 20, randomized 100, allocated 50 to A and 50 to B. Show follow-up losses of 3 and 2 separately. Analyze all 50 in each arm with a placeholder for the stated missing-data method. Label the example fictional and do not invent trial outcomes.
Use this prompt in the generatorCONSORT Flow Diagram FAQ
What does a CONSORT flow diagram show?
It summarizes participant progress through enrollment, allocation, follow-up and analysis in a randomized trial.
Is it the same as a PRISMA flow diagram?
No. CONSORT follows trial participants; PRISMA describes identification and selection of reports for a systematic review.
Should follow-up losses be subtracted from analysis?
Not automatically. The analysis population and missing-data method determine how participants are handled. Explain them explicitly.
Does the count checker validate my trial?
No. It checks a few arithmetic relationships only, not protocol adherence, missing-data validity or CONSORT compliance.
Sources and editorial notes
Prepared by the AcaDraw product team. Source and diagram check: . This is a simplified educational model; independent expert review has not been completed. AI-generated drafts need checking against reliable references.
Explore the consort flow diagram guide
Keep participant flow separate from trial outcomes, and distinguish follow-up status from analysis membership.
CONSORT Flow Diagram: Participant Counts from Enrollment to Analysis