Character Relationship Map Generator
A character relationship map makes a story’s social structure visible. Use this generator to place characters, label relationships and mark how alliances or conflicts change across a draft.
SEE ACADRAW IN ACTION
Science drawing, from idea to editable figure
Create a science illustration with AI. Refine drawings, build editable diagrams, and convert images to SVG.
Demos play as you scroll into view. Choose a feature to explore.
Trusted by students & researchers from 480+ universities
A global community spanning 60+ countries and regions, from QS top-ranked universities to leading research institutes
























University logos belong to their respective institutions and are shown solely to illustrate our user community. They do not imply any partnership or endorsement.
Tool overview
Explore the use cases, workflow, and key things to know.
Set the scope
Choose the chapter, arc or draft version the map will represent.
Add and label nodes
Place characters and use a short relationship vocabulary with a legend.
Review the change
Mark reveals, conflicts and alliances that shift across the story.
Concept reference
Character relationship map: a worked reference
The example places Maya at the center of a small fictional ensemble and labels Trust, Conflict, Mentor and Alliance relationships. Dashed lines indicate change after a turning point; the map is a story-planning aid.
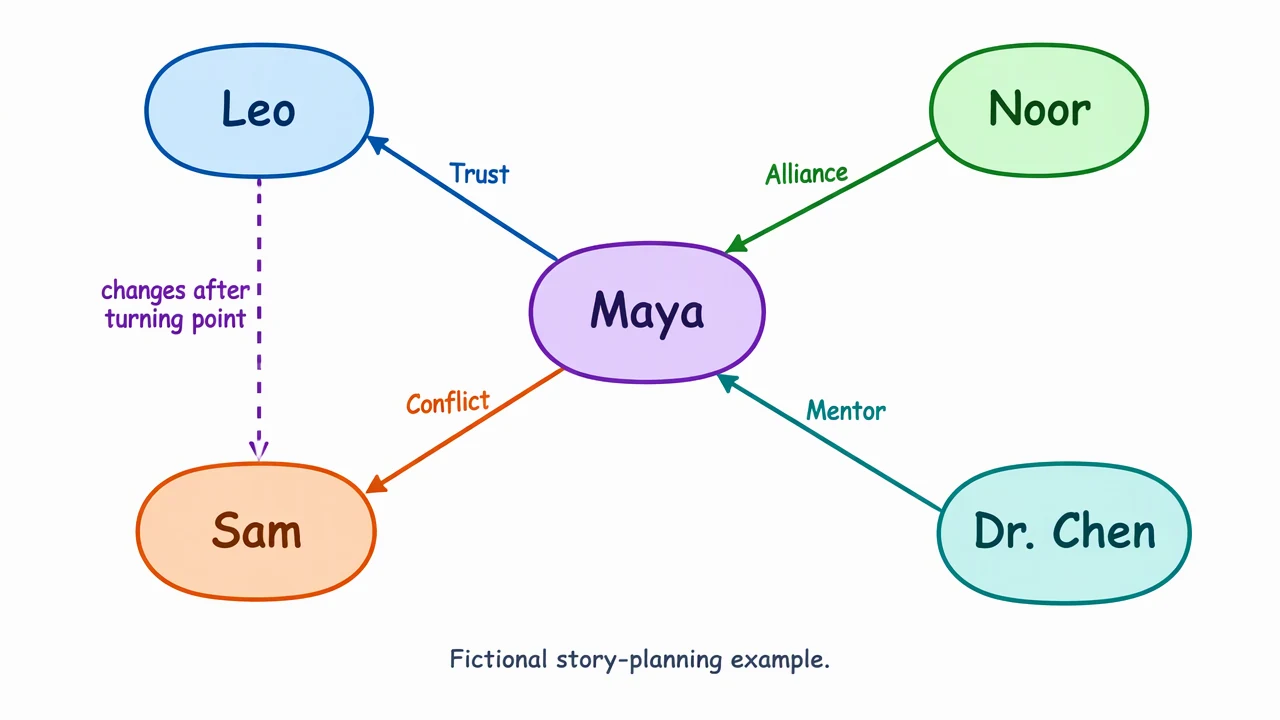
Character relationship map key
Use the reference and definitions together. On a small screen, scroll the table horizontally.
| Element | Meaning | Review check |
|---|---|---|
| Character node | A person or role in the story | Give the node a stable name and scope it to the draft. |
| Relationship label | Trust, conflict, alliance or another story relation | State what the label means and whose viewpoint it represents. |
| Direction | One-way or mutual relationship | Use arrows only when direction matters, such as influence or information. |
| Time marker | Chapter, scene or turning point | A relationship can change; record when the map applies. |
| Legend | Meaning of line style or color | Do not make readers infer conventions from decoration. |
Plan your character relationship map
Map relationships with labels and a time or chapter scope. Lines communicate your chosen story convention, not measured data or a universal hierarchy.
Map the story version
A relationship map describes a chosen draft or chapter. Update it when a reveal changes what a character knows.
Label viewpoint
“Trust” may be mutual, asymmetric or unreliable. Add a viewpoint note when that distinction matters.
Keep it readable
A few strong relationships are easier to edit than every incidental encounter.
Common mistakes to avoid
Unlabeled lines
A line without a legend can be mistaken for friendship, family or causality.
Mixing timelines
Combining early and late relationships hides the turning point that changes them.
Confusing proximity with importance
Node placement is layout, not a ranking of characters.
Character Relationship Map Generator: from brief to checked draft
Reading the reference is free. Generating a new draft requires an account and available credits. See current pricing.
Choose Science Drawing for an illustrated draft, or Editable Diagram for separate shapes and labels. Review all definitions, labels and connections before sharing.
- 1
Set the scope
Choose the chapter, arc or draft version the map will represent.
- 2
Add and label nodes
Place characters and use a short relationship vocabulary with a legend.
- 3
Review the change
Mark reveals, conflicts and alliances that shift across the story.
A prompt you can adapt
Create an original fictional character relationship map on a clean white landscape canvas. Center node Maya; surrounding nodes Leo, Noor, Sam, and Dr. Chen. Label lines Trust, Conflict, Alliance, Mentor; use one dashed line labeled changes after turning point. Add footer Fictional story-planning example. No real people, no logos, readable exact English labels.
Use this prompt in the generatorCharacter Relationship Map FAQ
What is a character relationship map?
It is a visual story-planning tool that places characters and labels their relationships.
Should every character appear?
Include characters relevant to the chosen chapter or arc; a smaller map is easier to read and revise.
Do arrows mean importance?
No. They should indicate a defined direction such as influence, knowledge or communication.
Can relationships change?
Yes. Use chapter or turning-point markers and keep separate versions when the story changes.
Sources and editorial notes
Prepared by the AcaDraw product team. Source and diagram check: . This is a simplified educational model; independent expert review has not been completed. AI-generated drafts need checking against reliable references.
Explore the character relationship map guide
Map relationships with labels and a time or chapter scope. Lines communicate your chosen story convention, not measured data or a universal hierarchy.
Character Relationship Map: Track Alliances, Conflict, and Change