Ecomap Maker
Use an ecomap maker to draft a visual map of a household or client system and the people, services and communities around it. Use line styles consistently, protect personal information and review the map with the people it represents.
SEE ACADRAW IN ACTION
Science drawing, from idea to editable figure
Create a science illustration with AI. Refine drawings, build editable diagrams, and convert images to SVG.
Demos play as you scroll into view. Choose a feature to explore.
Trusted by students & researchers from 480+ universities
A global community spanning 60+ countries and regions, from QS top-ranked universities to leading research institutes
























University logos belong to their respective institutions and are shown solely to illustrate our user community. They do not imply any partnership or endorsement.
Tool overview
Explore the use cases, workflow, and key things to know.
Set a safe scope
Use a fictional or consented case and avoid entering identifying information.
Define line meanings
A legend should explain connection, support and stress lines before the reader interprets them.
Invite correction
An ecomap is most useful when the people represented can review and revise it.
Concept reference
Ecomap reference: people, systems, and support connections
This fictional ecomap places a household at the center and connects it to school, work, healthcare, community and friends. Solid, dashed and zigzag lines show different relationship qualities as a teaching convention; they are not a clinical assessment.
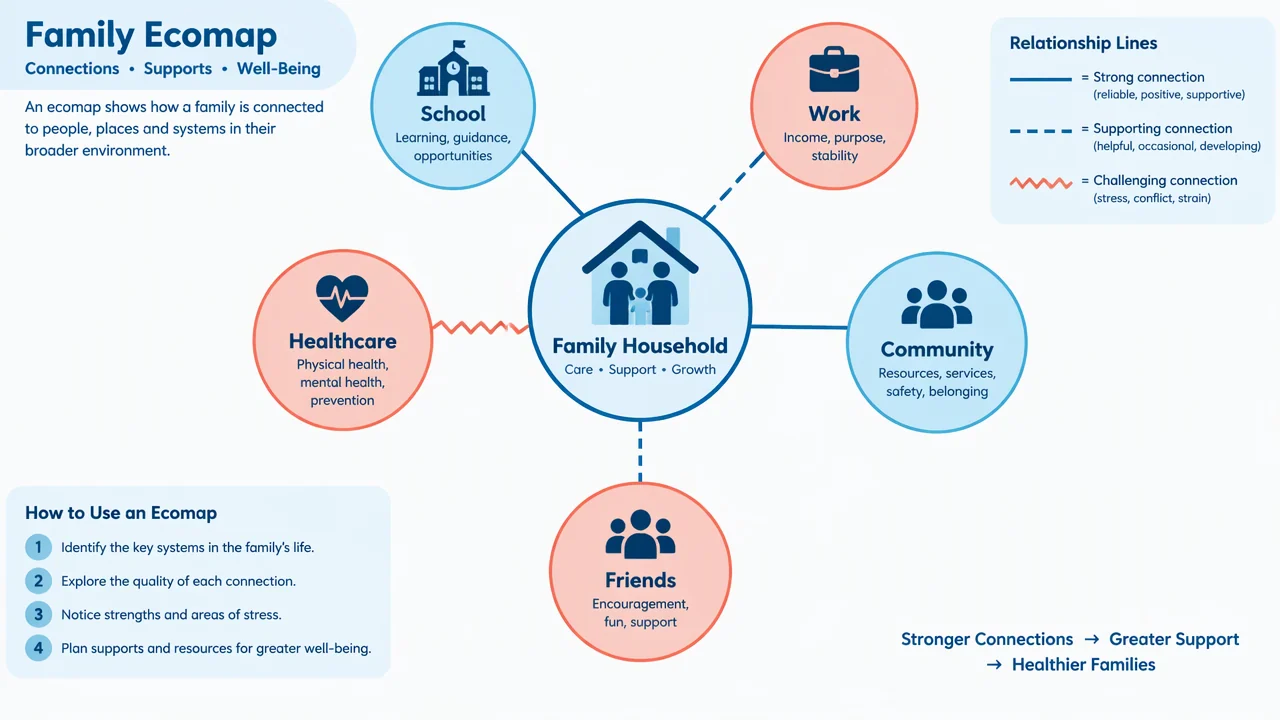
Ecomap element guide
Use the reference and definitions together. On a small screen, scroll the table horizontally.
| Element | Meaning in the example | Drawing check |
|---|---|---|
| Household circle | The family, client or focal system at the center | State who is included and the date of the map. |
| External system | School, work, healthcare, community or friends surrounding the household | Use categories that fit the case rather than copying a fixed list. |
| Connection line | A line style represents the relationship or flow of support | Add a legend; line weight alone should not carry an unexplained meaning. |
| Support direction | An arrow can show resources moving toward or away from the focal system | Use arrows only when direction is relevant and agreed. |
| Stress or conflict note | A visual cue can flag strain for discussion | Do not present a generated line as a diagnosis or verified finding. |
Use an ecomap as a conversation tool
An ecomap organizes context around a focal household or client. It should support a conversation and revision process, not replace professional judgment or consent.
Center the focal system
Define the household or client boundary before adding external systems.
Show context, not labels
A line can prompt a question about support or strain; it does not establish a clinical fact.
Protect the record
Use fictional placeholders in public examples and apply the privacy policy of your setting to real cases.
Common ecomap mistakes
Unclear legend
Readers should know what solid, dashed or zigzag lines mean.
Overconfident interpretation
A visual relationship cue is a discussion prompt, not an assessment result.
Unprotected information
Names, addresses and sensitive case details should not be placed in a public draft.
Create your own ecomap diagram
Reading the reference is free. Generating a new draft requires an account and available credits. See current pricing.
Choose Science Drawing for an illustrated draft, or Editable Diagram for separate shapes and labels. Review all definitions, labels and connections before sharing.
- 1
Define consent and scope
Choose a fictional case or confirm what information may be represented.
- 2
Map systems and lines
Add only relevant systems, with a legend for each connection style.
- 3
Review together
Ask whether the map reflects the people involved and revise it before sharing.
A prompt you can adapt
Create a clean, editable fictional family ecomap. Place a central household circle with school, work, healthcare, community and friends around it; use a legend for supportive, stressful and distant connections; include no personal data and state that the map is a conversation aid.
Use this prompt in the generatorEcomap diagram FAQ
What is an ecomap?
An ecomap is a visual map of a focal household or client system and its relationships with external systems.
Is an ecomap a diagnosis?
No. It is a contextual conversation and assessment aid, not a diagnosis or automatically verified finding.
What line styles should I use?
Choose a small, defined legend for supportive, stressful, distant or bidirectional relationships.
Can I use real client data?
Only within your organization’s consent, privacy and record-keeping rules. Use fictional details in public examples.
Can I edit an ecomap?
Yes. Use Editable Diagram to move systems, revise connections and update the legend.
Sources and editorial notes
Prepared by the AcaDraw product team. Source and diagram check: . This is a simplified educational model; independent expert review has not been completed. AI-generated drafts need checking against reliable references.
Create a ecomap diagram for your lesson
Choose the scope, generate a draft, then review labels and connections before sharing.
Ecomap Maker: Map Context Without Losing the Human Story