Research and learning tools
Scientific Color Palette Generator
Use the scientific color palette generator to choose a categorical, sequential or diverging palette, copy its HEX values and check text contrast against your background. The local tool is free; review the final figure with labels and non-color cues before sharing.
Choose a scientific color palette
Free local tool · no account or credits
Choose the background that will sit behind your labels. Enter a six-digit HEX color.
#176B91
Text contrast against background
5.92:1
Meets 4.5:1 for normal text
#CA5A1E
Text contrast against background
4.21:1
Meets 3:1 for large text only
#287D75
Text contrast against background
4.91:1
Meets 4.5:1 for normal text
#855299
Text contrast against background
5.73:1
Meets 4.5:1 for normal text
#657534
Text contrast against background
5.06:1
Meets 4.5:1 for normal text
WCAG AA text thresholds: 4.5:1 for normal text, 3:1 for large text (at least 18pt regular or 14pt bold). These ratios do not evaluate all adjacent colors or guarantee color-vision accessibility. Use direct labels and check the complete figure.
SEE ACADRAW IN ACTION
Science drawing, from idea to editable figure
Create a science illustration with AI. Refine drawings, build editable diagrams, and convert images to SVG.
Demos play as you scroll into view. Choose a feature to explore.
Trusted by students & researchers from 480+ universities
A global community spanning 60+ countries and regions, from QS top-ranked universities to leading research institutes
























University logos belong to their respective institutions and are shown solely to illustrate our user community. They do not imply any partnership or endorsement.
Tool overview
Explore the use cases, workflow, and key things to know.
Name the visual roles
List categories, order, midpoint and neutral elements before choosing swatches.
Draft and test
Generate a palette, apply it to an existing figure and inspect labels at presentation size.
Document the mapping
Add a legend and a non-color cue where the distinction affects interpretation.
Concept reference
Scientific color palette: a worked reference
The example groups an accessible palette into categorical, sequential and neutral roles. The swatches are a teaching reference, not a universal standard; test the final colors against your labels, background and print process.
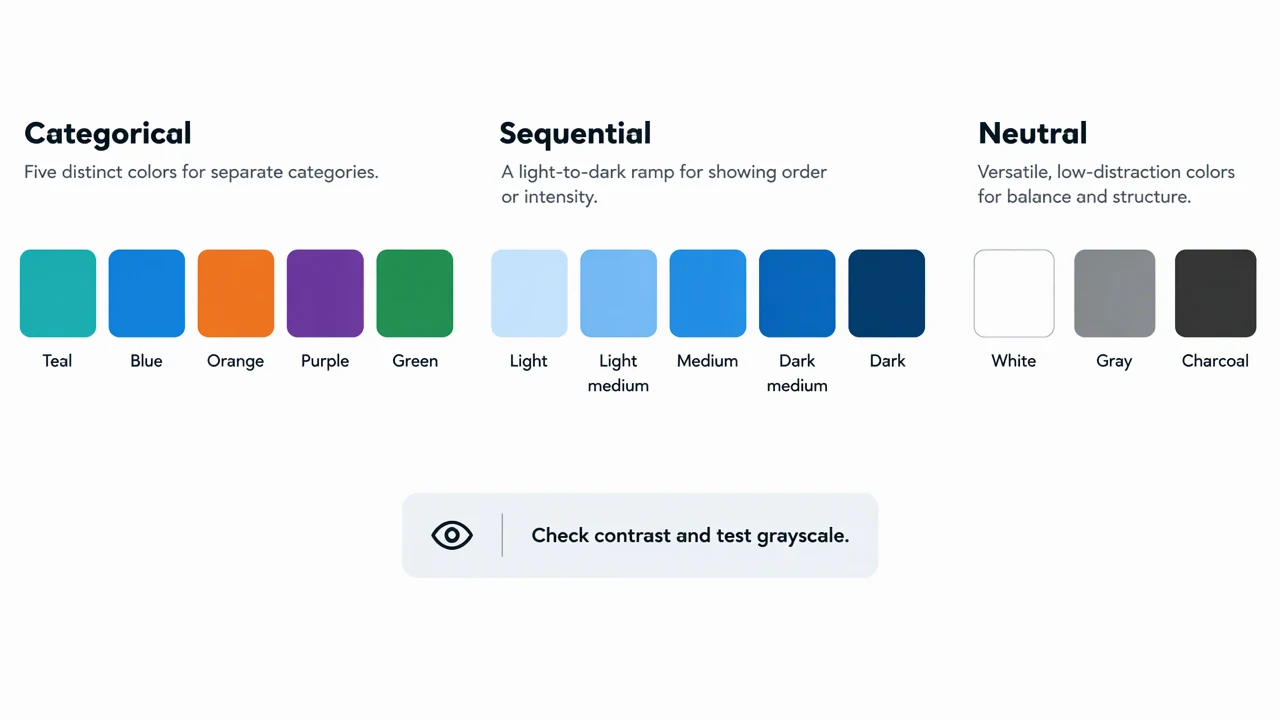
Scientific palette role key
Use the reference and definitions together. On a small screen, scroll the table horizontally.
| Element | Meaning | Review check |
|---|---|---|
| Categorical color | Separate named categories | Use distinct lightness and hue; do not imply ranking. |
| Sequential ramp | Ordered low-to-high emphasis | Keep lightness changing consistently and state what the order means. |
| Diverging pair | Values around a meaningful midpoint | Reserve the midpoint and explain the reference value. |
| Neutral support | Backgrounds, borders and annotations | Keep text contrast strong and avoid low-contrast gray labels. |
| Accessibility check | A review step before export | Test color vision, grayscale, projection and print reproduction. |
Plan your scientific color palette
Choose colors for meaning, contrast and reproduction. The palette supports existing figures and layouts; it does not analyze data or create statistical charts.
Color carries a claim
A hue is not evidence. If color represents a group, treatment or direction, state that mapping in a legend.
Contrast beats decoration
Light text on a saturated background can disappear in a projection or print. Check text and line contrast at the final size.
Make a fallback
Patterns, labels, line styles or direct annotation help readers when colors cannot be distinguished.
Common mistakes to avoid
Using rainbow order
A rainbow ramp can create false boundaries and uneven perceptual steps.
Encoding two variables in one hue
Separate category and magnitude roles or explain the combined encoding precisely.
Checking only a monitor
Preview the figure in grayscale and on the target paper or slide background.
Choose, copy and review your scientific color palette
Palette selection and contrast calculations run in your browser without an account or credits. No image or data upload is required.
The contrast result evaluates a swatch as text against the chosen background. It does not certify color-vision accessibility, distinguishability between all swatches or journal compliance.
- 1
Name the visual roles
List categories, order, midpoint and neutral elements before choosing swatches.
- 2
Draft and test
Generate a palette, apply it to an existing figure and inspect labels at presentation size.
- 3
Document the mapping
Add a legend and a non-color cue where the distinction affects interpretation.
A brief for applying your palette
Use the selected palette in an existing explanatory diagram. Keep a direct label on each category, use a neutral background and document what each color means. Check the final figure at its intended size.
Return to the palette toolScientific Color Palette FAQ
Is the scientific color palette generator free?
Yes. Palette selection, HEX copying and text-contrast calculations run locally without an account or credits. The tool does not generate statistical charts.
How many colors should a categorical palette use?
Use only as many as readers can distinguish in the final context. Split a crowded legend or add direct labels.
What is a sequential palette?
It uses a consistent visual progression to show an ordered concept. The order and midpoint should be explained.
How do I make a palette color-blind aware?
Check contrast and color-vision simulations, then add labels, patterns or line styles so color is not the only cue.
Sources and editorial notes
Prepared by the AcaDraw product team. Source and diagram check: . This is a simplified educational model; independent expert review has not been completed. AI-generated drafts need checking against reliable references.
Explore the scientific color palette guide
Choose colors for meaning, contrast and reproduction. The palette supports existing figures and layouts; it does not analyze data or create statistical charts.
Scientific Color Palette: Contrast, Meaning, and Accessible Figures