ER Diagram Generator
Use the ER diagram generator to turn domain rules into entities, attributes and relationships. Define keys, optionality and cardinality explicitly, then review the model before translating it into a database schema.
SEE ACADRAW IN ACTION
Science drawing, from idea to editable figure
Create a science illustration with AI. Refine drawings, build editable diagrams, and convert images to SVG.
Demos play as you scroll into view. Choose a feature to explore.
Trusted by students & researchers from 480+ universities
A global community spanning 60+ countries and regions, from QS top-ranked universities to leading research institutes
























University logos belong to their respective institutions and are shown solely to illustrate our user community. They do not imply any partnership or endorsement.
Tool overview
Explore the use cases, workflow, and key things to know.
State the domain rules
List entities, identifiers and minimum/maximum participation in plain language.
Generate the model
Use the ER diagram generator for a conceptual or logical view with one notation.
Read each relationship aloud
Verify both directions, key references and any junction entity.
Concept reference
Entity relationships: customers and orders
Three entities show a customer-to-orders relationship and an order-to-order-items relationship. Key labels and cardinality notes describe the example business rules.
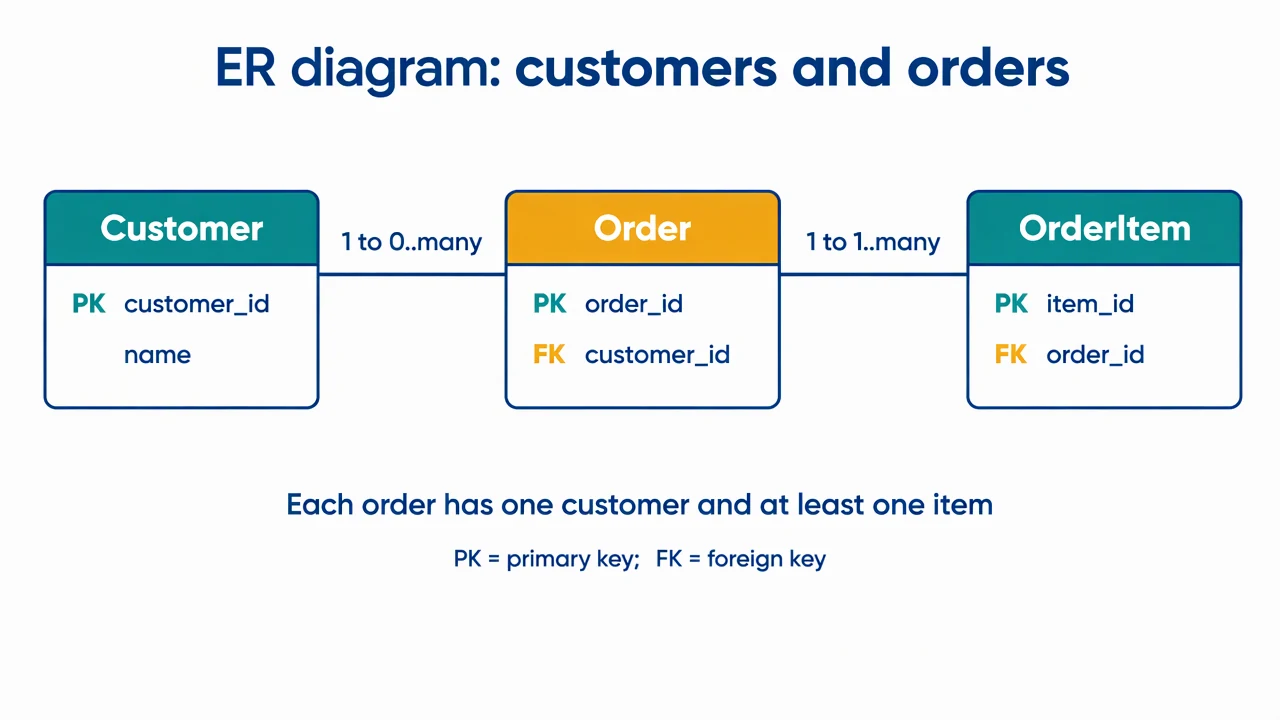
ER Diagram Generator: reference key
Use the reference and definitions together. On a small screen, scroll the table horizontally.
| Element | Meaning | Review check |
|---|---|---|
| Entity | A domain object or concept | Give it a singular, unambiguous name. |
| Attribute | A property belonging to an entity | Separate a property from a relationship. |
| Primary key | An identifier unique to each entity instance | State the identifier rule in a logical model. |
| Foreign key | A reference to another entity key | Keep it aligned with the relationship in a relational design. |
| Cardinality | The maximum number of related instances | Check both directions of each relationship. |
| Optionality | The minimum participation requirement | Use zero or one explicitly where the notation supports it. |
ER Diagram Generator: plan the visual
Use the ER diagram generator to turn domain rules into entities, attributes and relationships. Define keys, optionality and cardinality explicitly, then review the model before translating it into a database schema.
Start with business rules
Write statements such as each order belongs to one customer and a customer may place no orders. Feed these rules to the ER diagram generator before selecting a notation. Cardinality is a domain decision, not a decorative symbol to add after the boxes are drawn.
Choose conceptual or logical detail
A conceptual model may emphasize entities and relationships without columns. A logical relational model adds attributes, keys and junction entities. Keep these levels consistent so a stakeholder diagram does not become a mixture of domain vocabulary and implementation fragments.
Resolve many-to-many relationships deliberately
A student can enroll in many courses and a course has many students. A logical relational design often represents enrollment as a junction entity with its own relevant attributes. Review uniqueness and participation rules rather than merely adding another box.
Common mistakes to avoid
Assuming one means mandatory
Maximum cardinality and minimum participation are different. Specify whether zero related instances are allowed.
Putting every noun in its own table
Some nouns are attributes or roles rather than entities. Use identity and lifecycle to decide what merits a separate entity.
Treating a generated picture as a migration
A visual draft does not create or validate database constraints. Review keys, normalization and implementation separately.
ER Diagram Generator: from brief to draft
Reading the reference is free. Generating a new draft requires an account and available credits. See current pricing.
Choose Science Drawing for an illustrated draft, or Editable Diagram for separate shapes and labels. Review all definitions, labels and connections before sharing.
- 1
State the domain rules
List entities, identifiers and minimum/maximum participation in plain language.
- 2
Generate the model
Use the ER diagram generator for a conceptual or logical view with one notation.
- 3
Read each relationship aloud
Verify both directions, key references and any junction entity.
Example brief for the er diagram generator
Original educational scientific illustration on white, 1280x720 landscape. Crisp vector-like editorial artwork, navy text, teal and amber accents, generous whitespace, large legible English labels. All structures, labels and connecting arrows rendered by the image model. No third-party artwork, logo, photograph, experimental measurement or numerical performance claim. Title 'ER diagram: customers and orders'. Three entity boxes in a horizontal row: 'Customer' with 'PK customer_id' and 'name'; 'Order' with 'PK order_id' and 'FK customer_id'; 'OrderItem' with 'PK item_id' and 'FK order_id'. Connect Customer to Order labeled '1 to 0..many'; connect Order to OrderItem labeled '1 to 1..many'. Plain connector lines, no ambiguous arrowheads. Footnote 'Each order has one customer and at least one item'. Clear key 'PK = primary key; FK = foreign key'. No real data records or SQL code.
Use this prompt in the generatorER Diagram Generator: common questions
What does the ER diagram generator produce?
It drafts an entity-relationship visual from supplied domain rules, including entities, attributes and relationship labels.
Will it create a database?
No. The diagram is a design draft; schema definition, migrations and constraint validation remain separate tasks.
Can I use crow-foot notation?
You can request it, but inspect every endpoint. Explicit text labels for minimum and maximum participation help review AI-generated symbols.
Can I show a many-to-many relationship?
Yes. Keep it conceptual or introduce a junction entity for a logical relational model, according to your purpose.
Sources and editorial notes
Prepared by the AcaDraw product team. Source and diagram check: . This is a simplified educational model; independent expert review has not been completed. AI-generated drafts need checking against reliable references.
Explore the er diagram guide
Three entities show a customer-to-orders relationship and an order-to-order-items relationship. Key labels and cardinality notes describe the example business rules.
ER Diagrams: Entities, Keys, and Cardinality