Cladogram Maker
Use a cladogram maker to arrange taxa by shared derived traits. Keep the branching pattern, trait placements and taxon labels explicit, and treat the result as a simplified hypothesis that needs evidence.
SEE ACADRAW IN ACTION
Science drawing, from idea to editable figure
Create a science illustration with AI. Refine drawings, build editable diagrams, and convert images to SVG.
Demos play as you scroll into view. Choose a feature to explore.
Trusted by students & researchers from 480+ universities
A global community spanning 60+ countries and regions, from QS top-ranked universities to leading research institutes
























University logos belong to their respective institutions and are shown solely to illustrate our user community. They do not imply any partnership or endorsement.
Tool overview
Explore the use cases, workflow, and key things to know.
Define the scope
Choose the view, audience and labels before generating.
Keep relationships explicit
Use readable connectors, boundaries or arrows instead of decorative ambiguity.
Review before sharing
Check spelling, endpoints and claims against reliable references.
Labeled teaching reference
Cladogram reference: shared derived traits and branching groups
The cladogram groups taxa by nested shared derived traits. Each branch point marks a common ancestor in the simplified model, while the trait bars indicate characters shared by the descendants to their right.
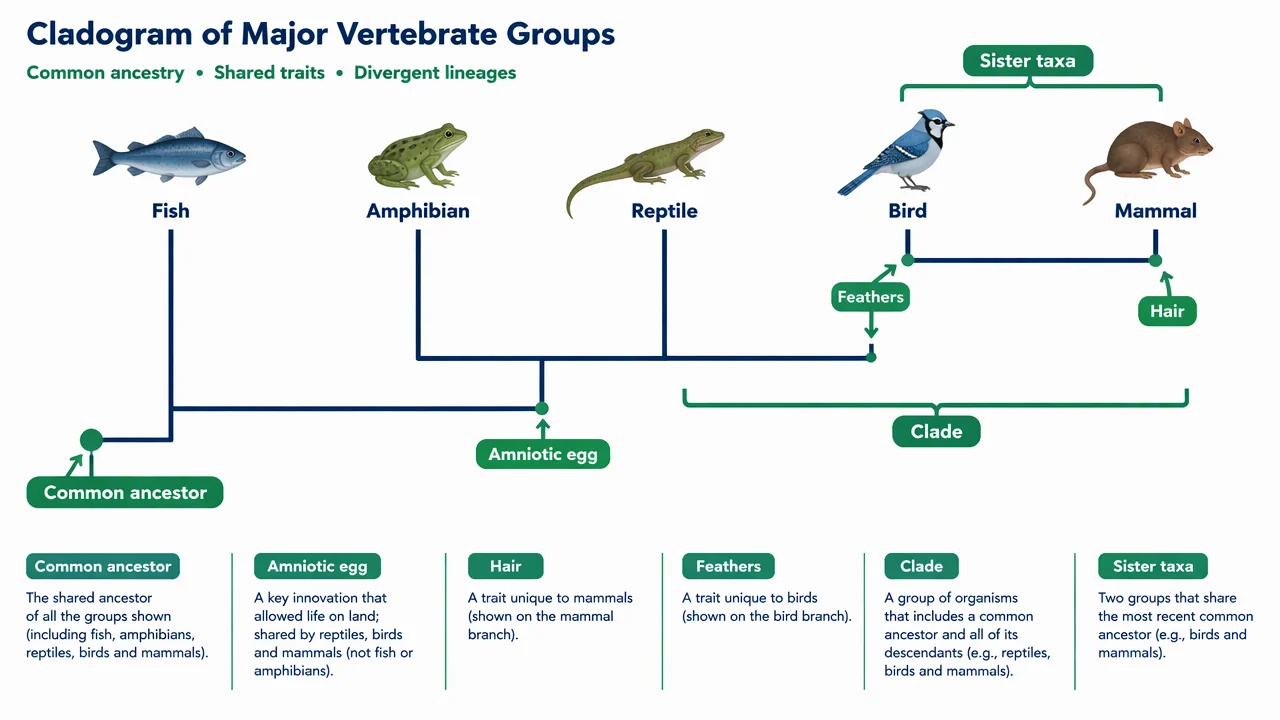
Cladogram label key
Use the labels with the reference, then choose the detail level your lesson needs. On a small screen, scroll the table horizontally.
| Label | Position | Meaning |
|---|---|---|
| Node | At a branch point. | A shared ancestor for the descendant branches. |
| Clade | A branch plus all descendants. | A nested group defined by common ancestry. |
| Shared derived trait | Along a branch or node. | A character used to support a grouping. |
| Sister taxa | Two closest terminal groups. | They share the most recent common ancestor in the shown topology. |
Build nested groups from shared traits
List the characters first, then group taxa that share newer traits while keeping older traits closer to the root.
Character placement matters
A trait bar should apply to every descendant branch it is intended to describe.
Topology is the message
Spacing and branch direction are layout choices unless a scale is provided.
Taxa need consistent names
Use the same rank or naming convention across terminal labels.
Common cladogram mistakes
Using traits that are not homologous
A useful character should support ancestry rather than superficial similarity.
Placing a trait on one tip by accident
Check every descendant branch covered by the trait marker.
Calling a cladogram a timeline
A cladogram shows nested relationships without an implied time scale.
Create your own cladogram diagram
Reading the reference is free. Generating a new draft requires an account and available credits. See current pricing.
Choose Science Drawing for an illustrated draft, or Editable Diagram for separate shapes and text labels. Review the science and all connections before using either result.
- 1
Define characters
Choose a short set of comparable traits and state their meanings.
- 2
Nest the groups
Arrange taxa by the most recent shared derived characters.
- 3
Audit the topology
Check every trait placement and explain the evidence behind the grouping.
A prompt you can adapt
Create a clean, editable cladogram with fish, amphibian, reptile, bird and mammal tips, labeled nodes and shared derived traits. Use noncrossing branches and add a note that the topology is a simplified relationship model, not a timeline.
Use this prompt in the generatorCladogram diagram FAQ
What is a cladogram?
A cladogram is a branching diagram that groups taxa by shared derived traits.
Is a cladogram the same as a phylogenetic tree?
A cladogram is a type of relationship diagram; phylogenetic trees can also include branch lengths, time or other inferred information.
What is a clade?
A clade includes a common ancestor and all of its descendants in the chosen tree.
Can I rotate a cladogram?
Yes. Rotating branches around a node preserves the relationships.
Does branch length show time?
Not unless the diagram explicitly defines a scale.
Sources and editorial notes
Prepared by the AcaDraw product team. Source and diagram check: . This is an introductory educational model; independent expert review has not been completed. Generated drafts need checking against reliable references.
Create a cladogram diagram for your lesson
Choose the scope, generate a draft, then review labels and connections before sharing.
Cladogram Maker: Place Shared Derived Traits Clearly