Causal Loop Diagram Generator
Use a causal loop diagram generator to explore a feedback hypothesis. Name variables that can increase or decrease, mark each link with its polarity and distinguish reinforcing from balancing loops. The diagram supports reasoning; it does not estimate effects or prove causality.
SEE ACADRAW IN ACTION
Science drawing, from idea to editable figure
Create a science illustration with AI. Refine drawings, build editable diagrams, and convert images to SVG.
Demos play as you scroll into view. Choose a feature to explore.
Trusted by students & researchers from 480+ universities
A global community spanning 60+ countries and regions, from QS top-ranked universities to leading research institutes
























University logos belong to their respective institutions and are shown solely to illustrate our user community. They do not imply any partnership or endorsement.
Tool overview
Explore the use cases, workflow, and key things to know.
Define link assumptions
Write what changes and what is held constant before assigning polarity. Correlation alone is not enough to justify a causal arrow.
Read the complete loop
Classify a loop by tracing all its signed links. A single negative edge does not tell you the behavior of the entire system.
Separate structure from simulation
A feedback sketch has no calibrated coefficients, time steps or forecast. Quantitative modeling requires additional equations and evidence.
Concept reference
Causal Loop Diagram: a worked example
The practice–skill example has two positive links and illustrates a reinforcing loop. The heating example connects Temperature gap to Heating with a positive link and returns with a negative link, illustrating balancing feedback. Both are simplified hypotheses with omitted influences.
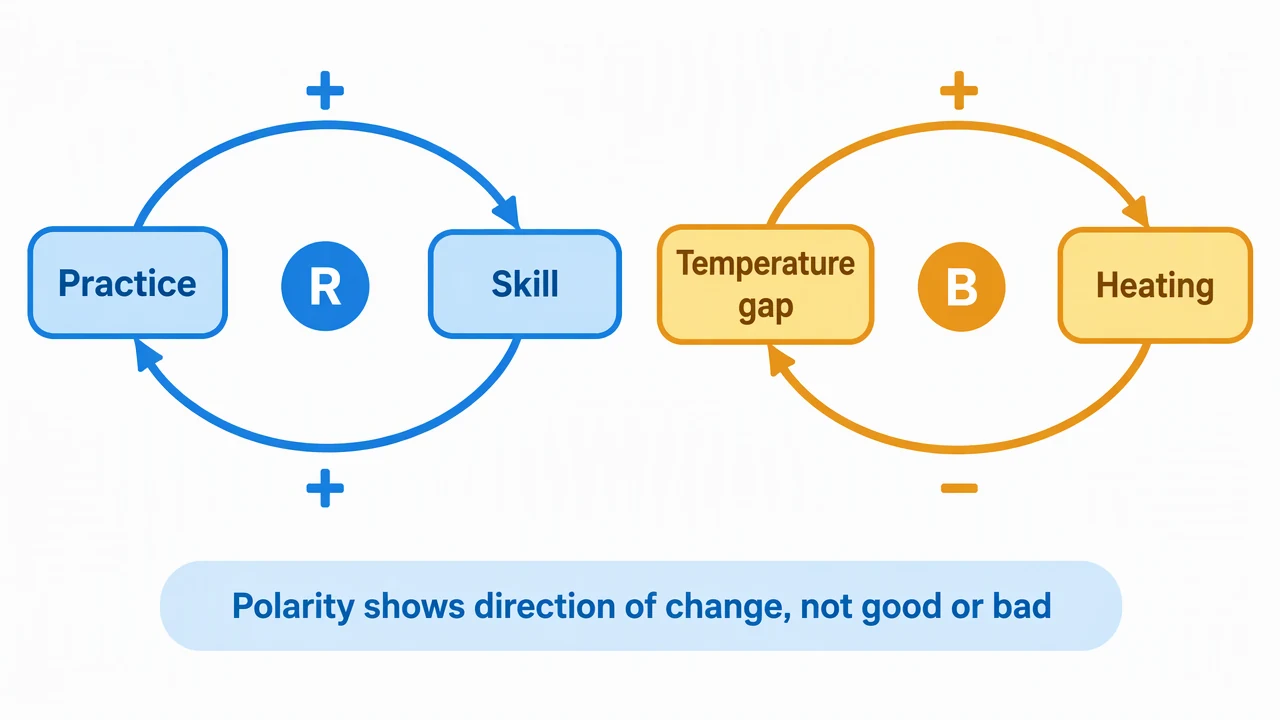
Causal Loop Diagram reference key
Use the reference and definitions together. On a small screen, scroll the table horizontally.
| Element | Meaning | Review check |
|---|---|---|
| Variable | A quantity or state that can change | Use names such as Temperature gap rather than an action sentence. |
| Positive link (+) | Variables change in the same direction, all else equal | An increase in the source tends to increase the destination relative to otherwise. |
| Negative link (−) | Variables change in opposite directions, all else equal | A minus sign is not a judgment that the effect is harmful. |
| Reinforcing loop (R) | An even number of negative links around the loop | Changes tend to amplify through the chosen loop. |
| Balancing loop (B) | An odd number of negative links around the loop | Feedback tends to counteract the initiating change. |
| Delay | The effect takes time to appear | Mark a delay explicitly rather than assuming an instantaneous response. |
Plan your causal loop diagram
Trace signed links around a loop instead of judging feedback by whether its outcome sounds good or bad.
Define link assumptions
Write what changes and what is held constant before assigning polarity. Correlation alone is not enough to justify a causal arrow.
Read the complete loop
Classify a loop by tracing all its signed links. A single negative edge does not tell you the behavior of the entire system.
Separate structure from simulation
A feedback sketch has no calibrated coefficients, time steps or forecast. Quantitative modeling requires additional equations and evidence.
Common mistakes to avoid
Good and bad labels
Positive and negative refer to direction of change, not desirability.
Event names as variables
Use a changing state such as Workload rather than an isolated event such as Hire staff.
Unsupported arrows
Each link needs a mechanism, source or explicit assumption that can be challenged.
Causal Loop Diagram Generator: from brief to checked draft
Reading the reference is free. Generating a new draft requires an account and available credits. See current pricing.
Choose Science Drawing for an illustrated draft, or Editable Diagram for separate shapes and labels. Review all definitions, labels and connections before sharing.
- 1
Name changing variables
Choose a system boundary and variables that can increase or decrease.
- 2
Sign the links
Describe each mechanism and assign polarity under stated assumptions.
- 3
Trace the feedback
Check every loop, mark delays and remove unsupported causal claims.
A prompt you can adapt
Create an editable causal loop teaching diagram with two loops. Practice increases Skill and Skill supports Practice: mark both links + and the loop R. Temperature gap increases Heating and Heating reduces Temperature gap: mark + and − and the loop B. Include a polarity legend and state that these are qualitative hypotheses.
Use this prompt in the generatorCausal Loop Diagram FAQ
What is a causal loop diagram?
It is a qualitative map of variables connected by signed causal hypotheses, often arranged into feedback loops.
Does a positive link mean a good effect?
No. Positive means the source and destination change in the same direction, all else equal.
How do I identify balancing feedback?
Trace the loop. An odd number of negative links gives balancing polarity; an even number gives reinforcing polarity.
Can this predict a time series?
No. Simulation requires equations, parameters, time assumptions and validation beyond this diagram.
Sources and editorial notes
Prepared by the AcaDraw product team. Source and diagram check: . This is a simplified educational model; independent expert review has not been completed. AI-generated drafts need checking against reliable references.
Explore the causal loop diagram guide
Trace signed links around a loop instead of judging feedback by whether its outcome sounds good or bad.
Causal Loop Diagram: Read Polarity, Feedback, and Delays