Erstelle Science & Nature Level Wissenschaftliche Zeichnungen
in Sekunden.
AcaDraw verwandelt deine Worte in Sekunden in wissenschaftliche Illustrationen – perfekt für Prototypen, Präsentationen und Veröffentlichungen.
AKADEMISCHE GALERIE
Entdecke unsere Sammlung wissenschaftlicher Zeichnungen
Durchstöbere unsere kuratierte Auswahl KI-generierter Illustrationen für Forschung und Naturkunde.
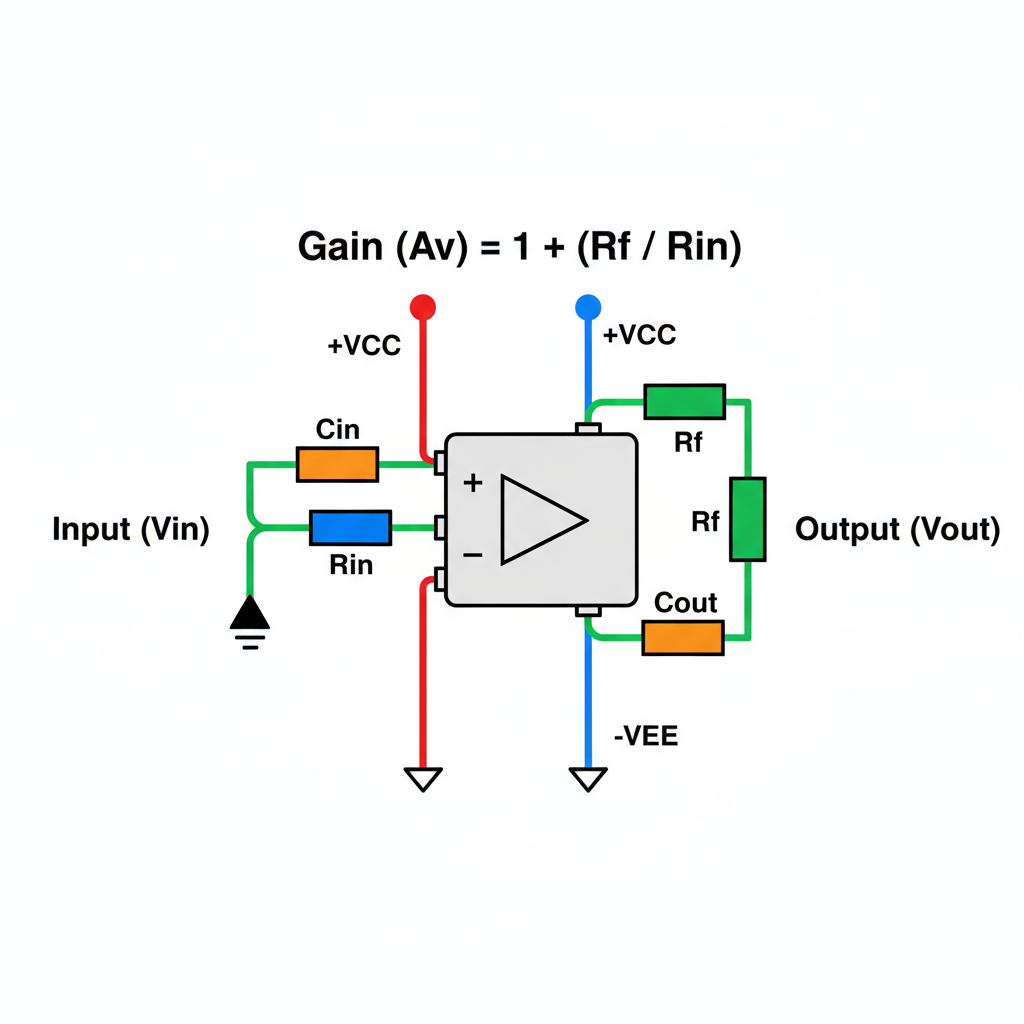
Draw a non-inverting op-amp amplifier with the gain formula annotated, use standard symbols, label inputs and outputs, fill resistors in different colors (e.g., blue, green), capacitors in orange, op-amp chip in light gray, use colored wires (positive in red, negative in blue, signal lines in green), use vibrant color fills, clean white background, high contrast, professional color scientific illustration
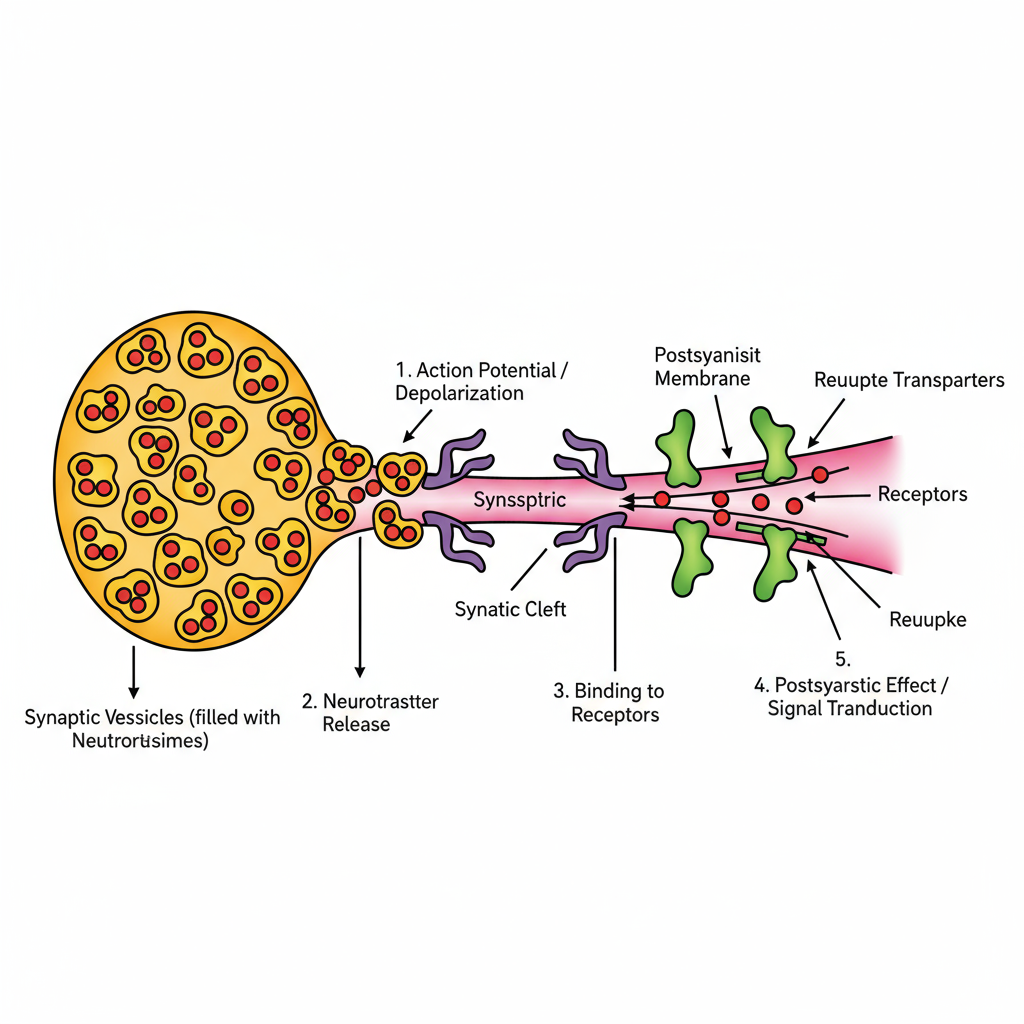
Draw a synapse schematic showing presynaptic vesicles, receptors, reuptake process, add sequence arrows and labels, fill vesicles in yellow or orange, neurotransmitters in red or blue, receptors in green, postsynaptic membrane in pink, use vibrant color fills, clean white background, high contrast, labeled callouts with leader lines, professional color scientific illustration
/biology-cell-structure-eukaryotic-cross-sectional-relationships-en.png)
Draw me a eukaryotic animal cell structure, label all the key organelles like nucleus, mitochondria, ER, Golgi, ribosomes, and cytoskeleton. Show where they're roughly located and their size relationships. Use a cross-sectional cutaway view, fill each organelle with distinct vibrant colors (e.g., nucleus in blue, mitochondria in red, ER in yellow), use bright and eye-catching colors, clean white background, high contrast, minimal shading, labeled callout lines, professional color scientific illustration vibe
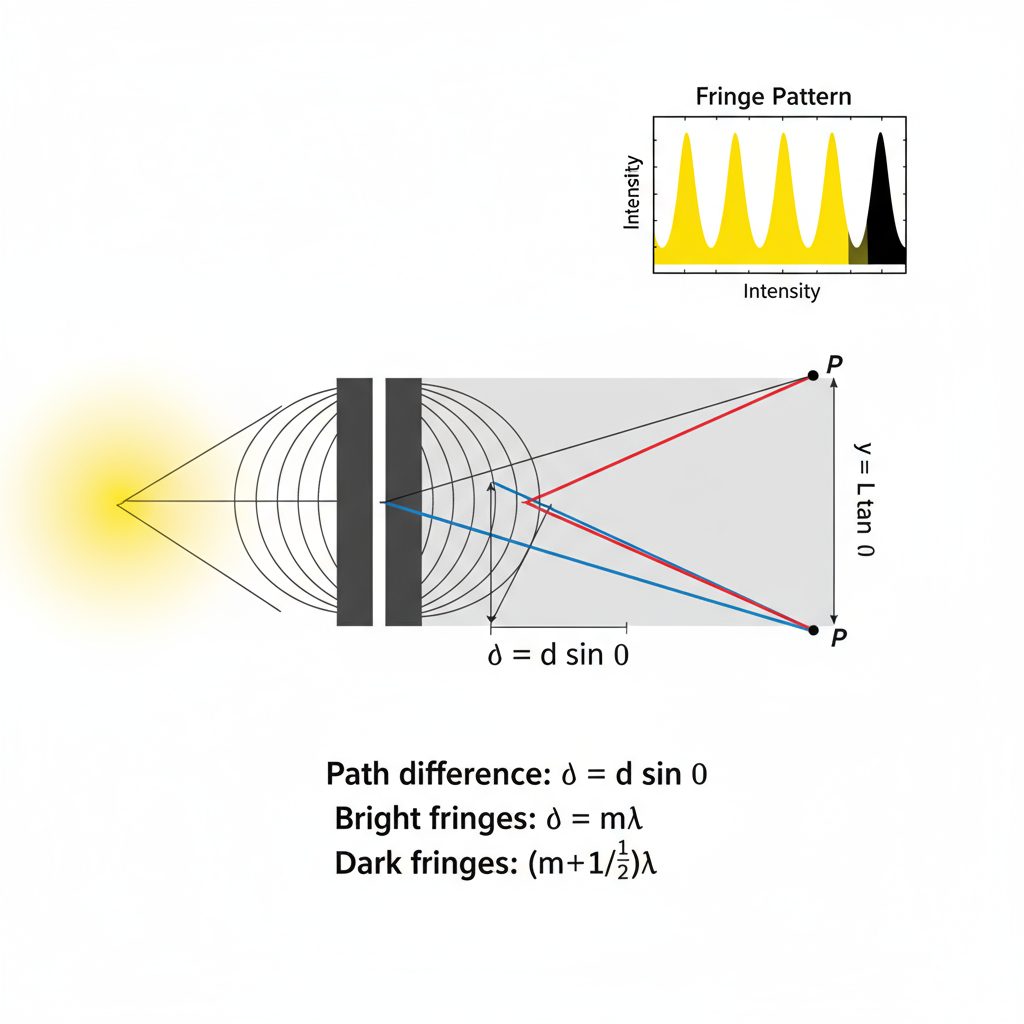
Draw Young's double-slit setup schematic showing path difference, add a small graph inset showing the fringe pattern, write key equations as captions, fill light source in yellow or red, double-slit plate in dark gray, screen in light gray, use colored light paths (e.g., red, blue), use colored fringe pattern (bright fringes in yellow, dark fringes in dark color), use vibrant color fills, clean white background, high contrast, professional color scientific illustration
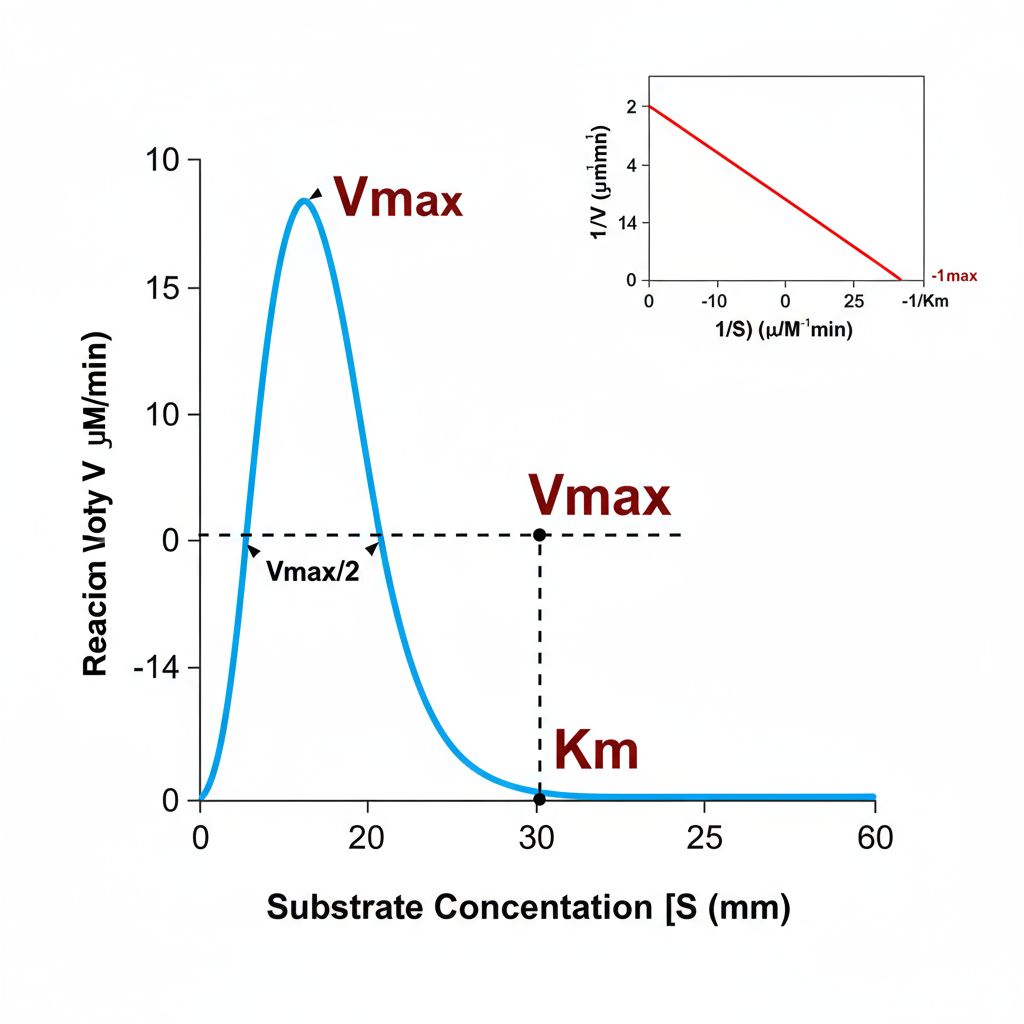
Draw a Michaelis–Menten curve, mark Km and Vmax clearly, add a small inset in the top right showing the Lineweaver–Burk plot, axis titles and units clearly labeled, use vibrant colors for the curve (e.g., blue or red), dark colors for axes and labels, clean white background, high contrast, professional color scientific chart style
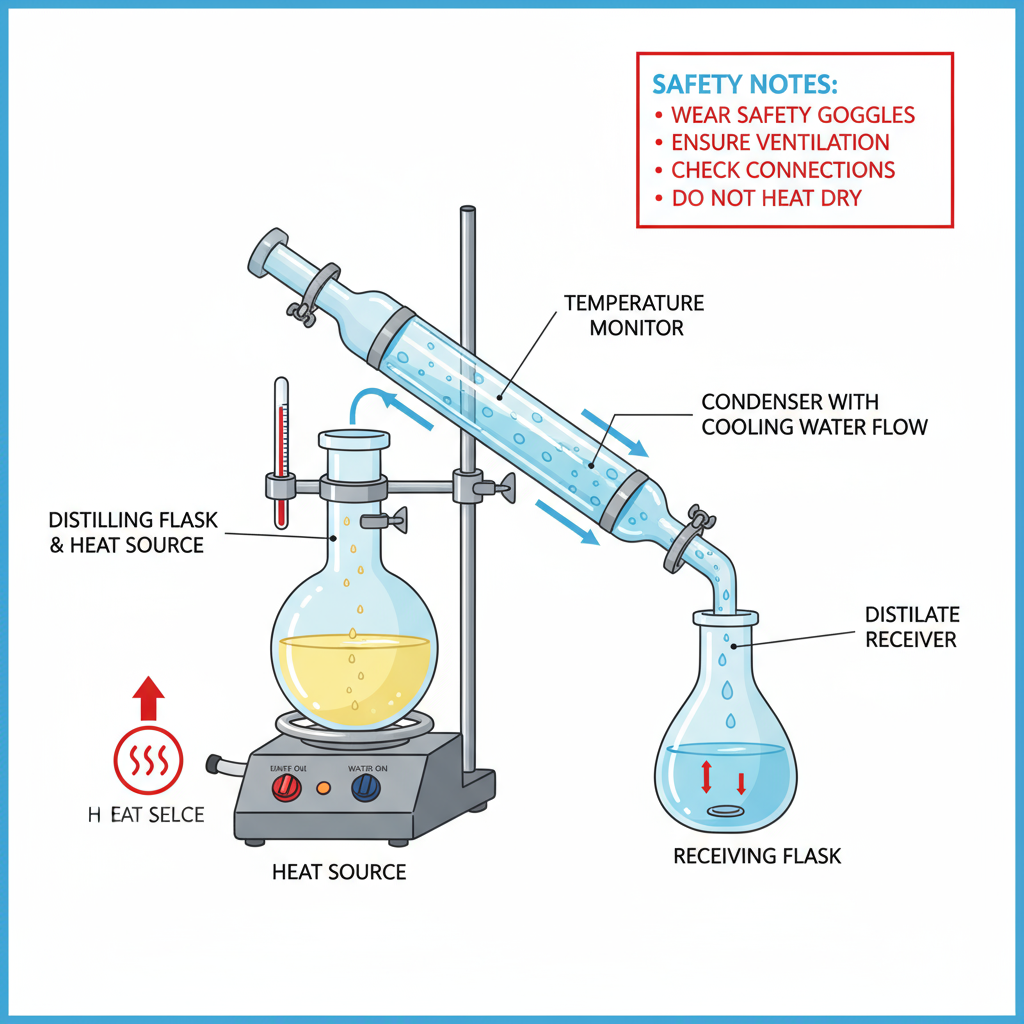
Draw a labeled distillation setup, include the heat source, condenser with flow arrows, receiving flask, plus safety notes, glassware in light blue or transparent effect, metal parts in silver or gray, liquids in light blue or yellow, arrows in red or blue, use vibrant color fills, clean white background, high contrast, labeled callouts with leader lines, professional color scientific illustration
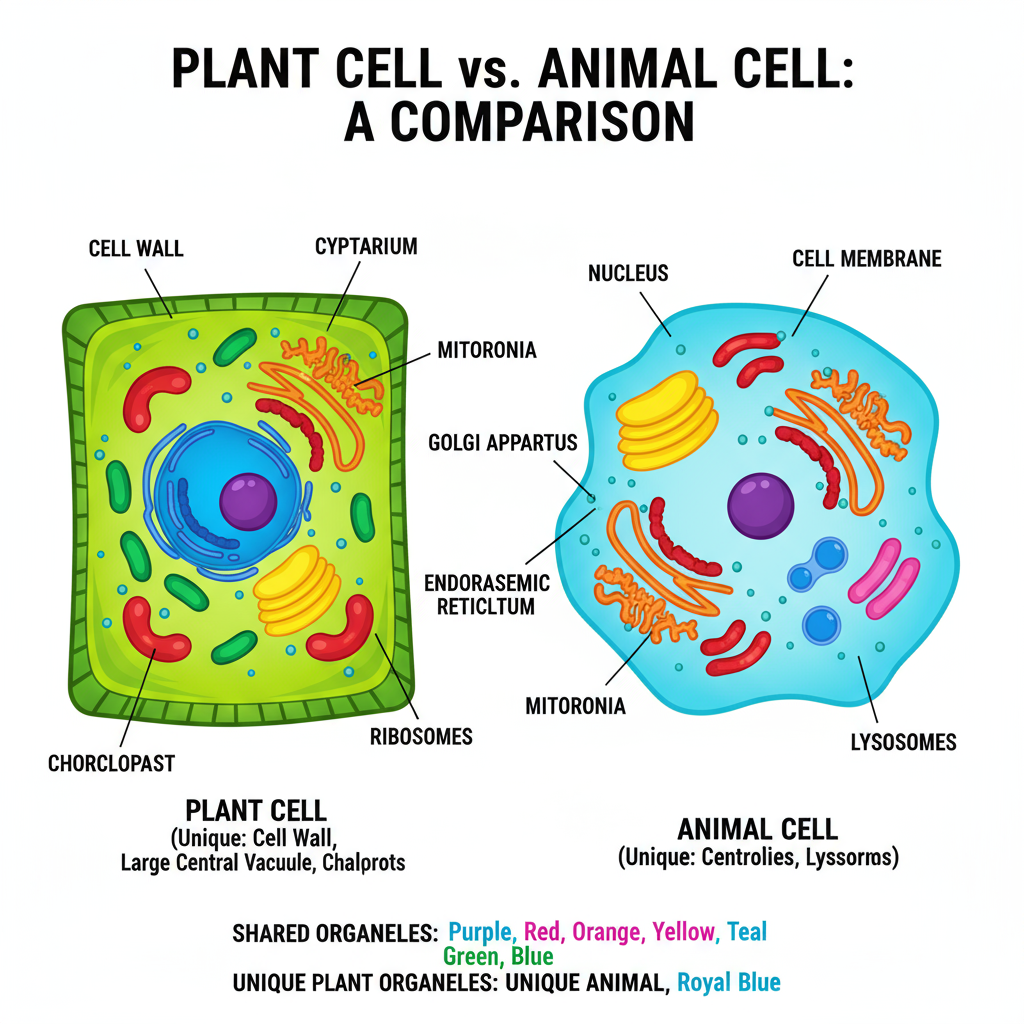
Side-by-side comparison of plant cell and animal cell, use vibrant distinct colors to highlight what they share vs what's unique, fill each organelle with rich colors, not just outlines, add captions and labels, make it textbook style, clean white background, high contrast, minimal shading, labeled callouts, professional color scientific illustration feel
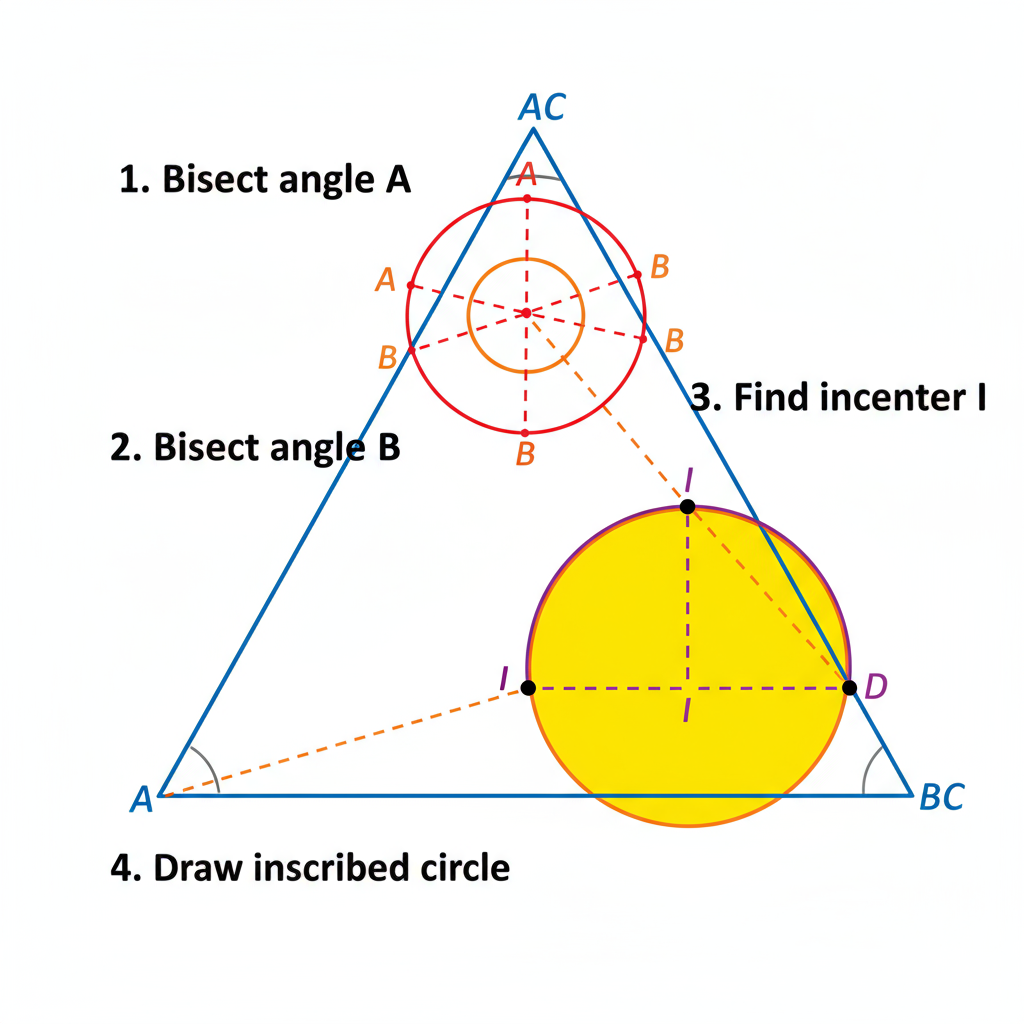
Draw a construction diagram for the inscribed circle of a triangle, compass-and-straightedge style, annotate each step, draw triangle in blue or green lines, use different colors for compass marks (e.g., step 1 in red, step 2 in orange, step 3 in purple), fill final circle with vibrant color (e.g., yellow or pink), use vibrant color fills, clean white background, high contrast, professional color scientific illustration
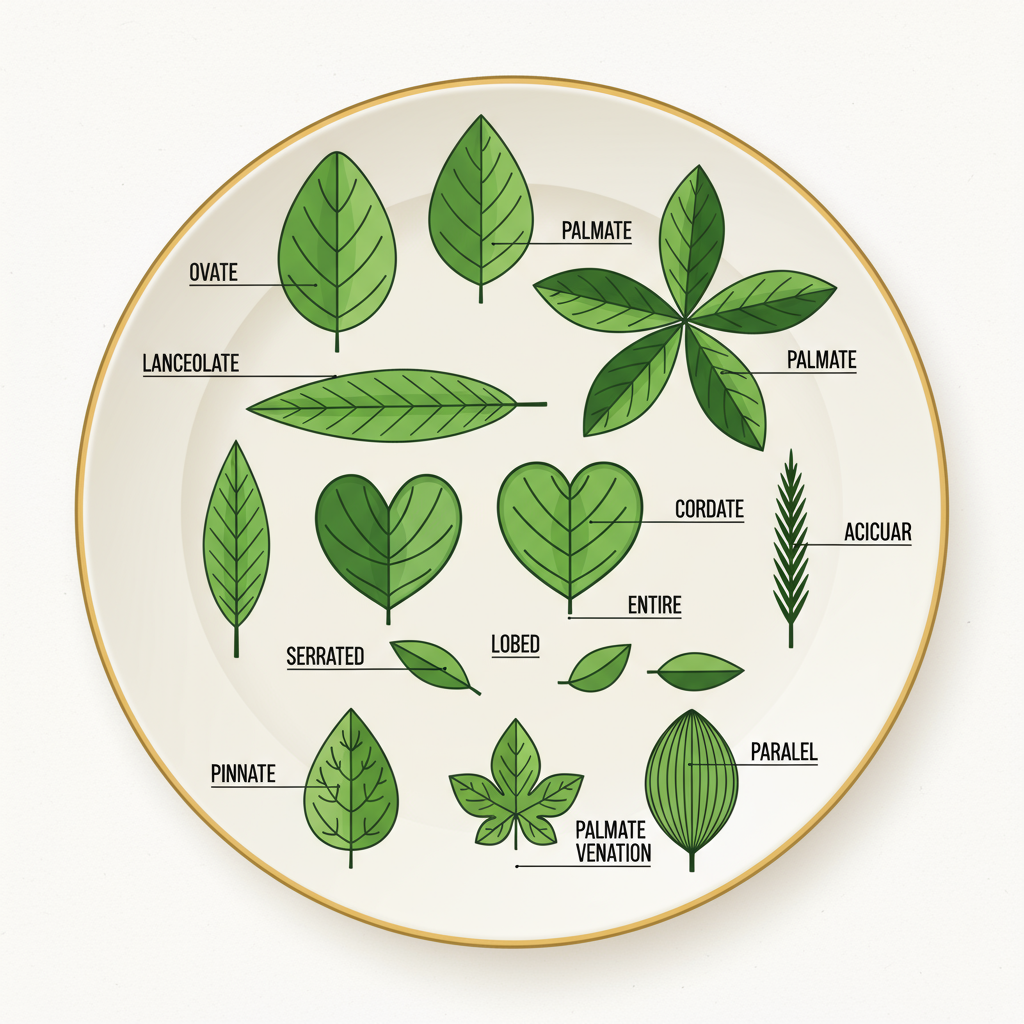
Make a plate showing different leaf shapes (ovate, lanceolate, palmate, etc.), margin types, and venation patterns. Label each one clearly, herbarium-style plate feel, fill leaves with various shades of green (light green, medium green, dark green), veins in dark green, use vibrant color fills, clean white background, high contrast, labeled callouts with leader lines, professional color scientific illustration
Deine Lieblingsunternehmen sind unsere Partner
Wissenschaft zeichnen – sofort.
Sekundenschnell Ergebnisse
Profi-Tools für Illustrationen mit wissenschaftlichem Anspruch.
Wissenschaft zeichnen – sofort.
Profi-Tools für Illustrationen mit wissenschaftlichem Anspruch.

Von Worten zu Kunst
Beschreiben, generieren, verfeinern
Sag AcaDraw, was du brauchst, und passe das Ergebnis sekundenschnell an.
Von Worten zu Kunst
Sag AcaDraw, was du brauchst, und passe das Ergebnis sekundenschnell an.
- Natürliche Sprache
- Sofortige Vorschau
- Ein-Klick-Optimierung
- Intelligenter Gesprächsfluss


Angetrieben von Top-KI-Modellen
Nano Banana & Seedream 4.0
Ausdrucksstarke Paletten und präzise Details für Publikationen.
Schnell
Ergebnisse in wenigen Sekunden.
Wissenschaftliche Genauigkeit
Technische & anatomische Präzision.
Mehrsprachig
Beschreibe dein Motiv auf Deutsch oder Englisch.
Interaktiver Chat
Iteriere per Konversation.
Mehrere Stile
Vektor, technische Zeichnungen, Diagramme.
Einfach zu nutzen
Keine Designskills nötig.
Flexible Pläne
Wähle den Plan, der zu dir passt
Kostenlos
Basisfunktionen für den persönlichen akademischen Gebrauch
- Registriere dich und erhalte 20 kostenlose KI-Credits
- KI-gestützte Wissenschaftszeichnungen (5x)
- AI-Diagramme: 3 Credits pro Generierung, 1 Credit pro Bearbeitung
- Intelligente Umwandlung in editierbare SVG (1x nur Text, 3x vollständig)
- Ausgabe in Standardqualität
- Export als PNG
- Community-Support
- Nur für persönlichen Bildungsgebrauch
Max
Erweiterte Credits für leitende Forschende
- 1.800 KI-Credits pro Monat
- KI-gestützte Wissenschaftszeichnungen (5x)
- AI-Diagramme: 3 Credits pro Generierung, 1 Credit pro Bearbeitung
- Intelligente Umwandlung in editierbare SVG (1x nur Text, 3x vollständig)
- Ausgabe in hoher Qualität
- Export als PNG, JPG, SVG, PDF
- Priorisierter E-Mail-Support
- Verlauf 90 Tage gespeichert
- Exports ohne Wasserzeichen
- Lizenz für Veröffentlichungen in Fachzeitschriften / kommerzielle Nutzung
Pro
Mehr KI-Credits für einzelne Forschende
- 500 KI-Credits pro Monat
- KI-gestützte Wissenschaftszeichnungen (5x)
- AI-Diagramme: 3 Credits pro Generierung, 1 Credit pro Bearbeitung
- Intelligente Umwandlung in editierbare SVG (1x nur Text, 3x vollständig)
- Ausgabe in hoher Qualität
- Export als PNG, JPG, SVG, PDF
- Priorisierter E-Mail-Support
- Verlauf 30 Tage gespeichert
- Exports ohne Wasserzeichen
- Lizenz für Veröffentlichungen in Fachzeitschriften / kommerzielle Nutzung
FAQ
Häufige Fragen
Stimmen
Was Forschende sagen
Dr. Lin Chen
MolekularbiologinAcaDraw verwandelt Mikroskopiebefunde in Minuten in publizierbare Skizzen.
Prof. Maya Singh
Organische ChemikerinReaktionsmechanismen und Spektren sind blitzschnell und konsistent erstellt.
Dr. Leo García
AstrophysikerFlächendiagramme und Annotationen erleichtern das Erklären von Teleskopdaten.
Dr. Sara Okoye
GeologinStratigraphie-Diagramme und Schnitte sind präzise und exportieren makellos.
Dr. Hana Yamamoto
NeurowissenschaftlerinNeuronale Schaltpläne wirken handgezeichnet und bleiben dennoch als Vektoren editierbar.
Dr. Amir Haddad
MaterialwissenschaftlerKristallgitter und Prozessflüsse sind sauber und reproduzierbar.
Dr. Olivia Martins
ÖkologinFelddaten werden zu polierten Abbildungen – unser Labor liefert dreimal schneller.
Dr. Ethan Park
PhysikdozentFür Praktika und Klausuren erstelle ich konsistente Diagramme in Sekunden.
Dr. Nadia Ivanova
OzeanografinKartenschnitte integrieren sich nahtlos in GIS-Exporte.
Dr. Gabriel Rossi
UmweltingenieurCompliance-Reports brauchen klare Visuals – AcaDraw spart uns wöchentlich Stunden.
Dr. Priya Nair
PaläontologinMorphologische Tafeln sind gestochen scharf – Reviewer waren begeistert.
Dr. Ahmed Saleh
Datenvisualisierungs-ForscherVorlagen und Prompt-Kontrollen bieten Tempo und Kontrolle zugleich.
Newsletter
Werde Teil der Community
Abonniere unseren Newsletter für News und Updates
