AI Architecture Diagram Generator
Use an AI architecture diagram generator to sketch how inputs move through data preparation, a model, evaluation and deployment. Label boundaries and feedback loops clearly, and treat the result as a conceptual communication draft rather than a production specification.
SEE ACADRAW IN ACTION
Science drawing, from idea to editable figure
Create a science illustration with AI. Refine drawings, build editable diagrams, and convert images to SVG.
Demos play as you scroll into view. Choose a feature to explore.
Trusted by students & researchers from 480+ universities
A global community spanning 60+ countries and regions, from QS top-ranked universities to leading research institutes
























University logos belong to their respective institutions and are shown solely to illustrate our user community. They do not imply any partnership or endorsement.
Tool overview
Explore the use cases, workflow, and key things to know.
Define the system boundary
State whether the diagram covers a research prototype, product flow or deployed service.
Separate data and model stages
Readers should see where data is collected, transformed, trained, evaluated and served.
Mark feedback and limits
Feedback loops and omitted infrastructure should be labeled rather than implied.
Concept reference
AI architecture diagram reference: from input to deployment
This conceptual architecture separates user input, data preprocessing, model behavior, evaluation and deployment. It is useful for explaining system boundaries, but it omits infrastructure, security, monitoring and implementation-specific constraints.
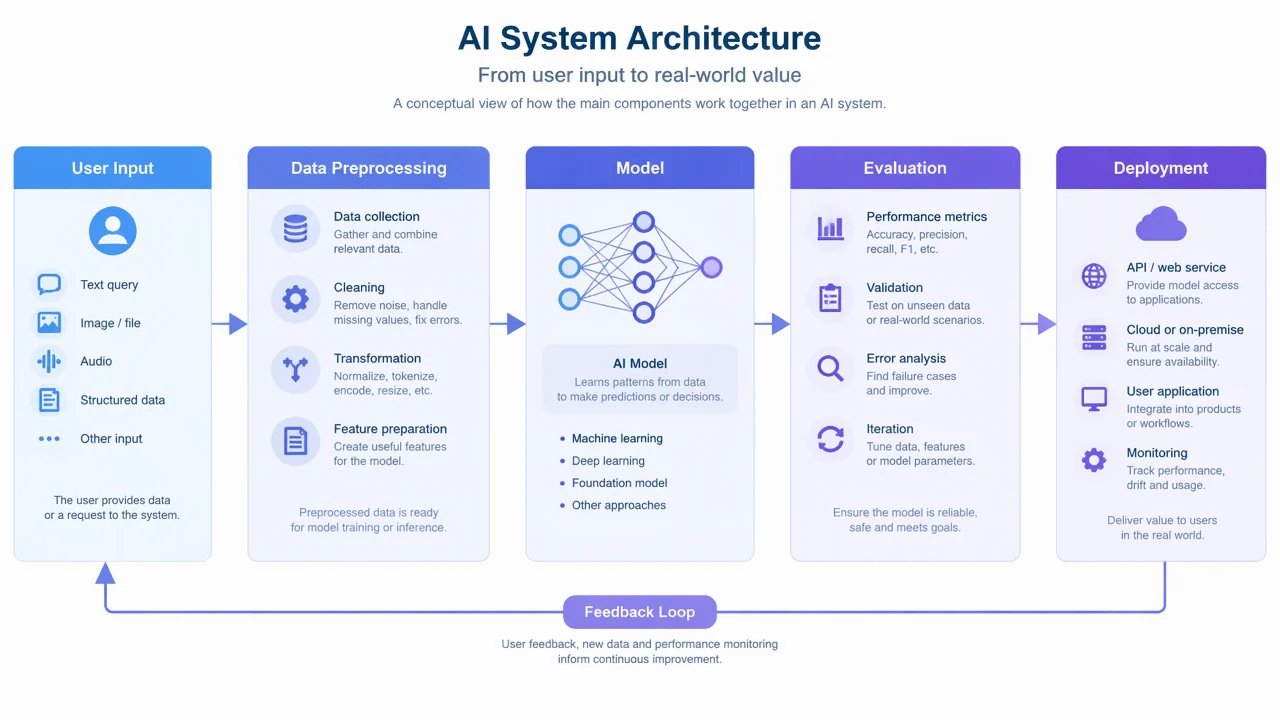
AI architecture diagram label key
Use the reference and definitions together. On a small screen, scroll the table horizontally.
| Block | Role in the conceptual system | Drawing check |
|---|---|---|
| User or data input | Requests, files, sensors or records entering the system | State what input is allowed and whether it is training or inference data. |
| Data preprocessing | Cleaning, transformation, feature preparation or tokenization | Do not imply that preprocessing is harmless or automatically unbiased. |
| Model | A trained or configured model that produces an output | Name the model family only when it is known; avoid inventing implementation details. |
| Evaluation | Tests, validation, error analysis and quality checks | Separate evaluation data from training data when that distinction matters. |
| Deployment | A service, application or endpoint that serves outputs | Add monitoring, access control and rollback notes for production discussions. |
Explain an AI architecture without overselling it
An architecture diagram helps people discuss components and interfaces. It should make assumptions visible and avoid presenting a high-level sketch as a secure or complete system design.
Show data boundaries
Data stores, external services and user inputs deserve separate labels and trust boundaries.
Name the feedback loop
Evaluation, monitoring and user feedback can influence later updates; show when that is intended.
Call out omitted work
Security, privacy, latency, cost and governance may sit outside a compact teaching diagram.
Common AI architecture diagram mistakes
Model as a black box
A box labeled “AI” hides inputs, outputs, evaluation and failure modes.
Training and inference mixed
Use separate arrows or stages when training data and live requests follow different paths.
Unwarranted production claim
A conceptual diagram is not proof of safety, scalability or compliance.
Create your own ai architecture diagram
Reading the reference is free. Generating a new draft requires an account and available credits. See current pricing.
Choose Science Drawing for an illustrated draft, or Editable Diagram for separate shapes and labels. Review all definitions, labels and connections before sharing.
- 1
Define the audience
Choose whether the diagram explains a prototype, research workflow or production service.
- 2
Map interfaces
List inputs, outputs, stores, external services and feedback before styling the boxes.
- 3
Review assumptions
Check that model, data and deployment claims match the evidence and intended scope.
A prompt you can adapt
Create a clean, editable conceptual AI architecture diagram. Show User Input, Data Preprocessing, Model, Evaluation and Deployment as labeled blocks with directional arrows and a feedback loop. Add a note that security, privacy, monitoring and infrastructure details are omitted from this high-level teaching model.
Use this prompt in the generatorAI Architecture diagram FAQ
What is an AI architecture diagram?
It is a visual explanation of the components, data flow and boundaries in an AI system.
Should training and inference be separate?
Usually yes when the distinction matters. Training data, model updates and live requests follow different paths.
Does the generator design a production system?
No. It creates a conceptual draft. Security, privacy, reliability and implementation review are still required.
Can I include a feedback loop?
Yes. Label whether feedback affects monitoring, evaluation, retraining or a later product decision.
Can I edit the architecture?
Yes. Editable Diagram mode lets you change blocks, connectors and boundary notes.
Sources and editorial notes
Prepared by the AcaDraw product team. Source and diagram check: . This is a simplified educational model; independent expert review has not been completed. AI-generated drafts need checking against reliable references.
Create a ai architecture diagram for your lesson
Choose the scope, generate a draft, then review labels and connections before sharing.
AI Architecture Diagram Generator: Make Data and Model Boundaries Visible